BRIGADE
Brigade Enterprises (BRIGADE)
Latest view
—
as of 1 Aug 2026 · not a recommendation
Evidence timeline
What management said
from NSE earnings-call filings · extracted, not interpreted
generic growth 20.0%
If the current sentiment and market conditions hold up, our outlook is that demand on ground will support a pre-sales outlook of at least 20% growth on our FY '26 numbers and aiming for INR9,000 crores.
Call 11-May-2026 · transcript PDF
Outlook, as stated
In both Bengaluru and Hyderabad, the share of FY 27 sales from new launches in mid-segment can be more front-ended, whereas in Chennai and ultra-luxury projects in general, the sales absorption is generally evenly distributed throughout the construction life cycle.
While the price rise in Bengaluru over the last 2, 3 years has been really substantial, all of our projects that are being launched today, I think, are being launched with the expectation that we can still take price hikes to 7% year-over-year.
The capital expenses towards the construction of this 10 million square feet will be approximately INR6,000 crores spread over the next 4 years, ranging between INR1,200 crores to INR1,700 crores per annum.
4.39
concrete references per 100 words spoken — counts, currency, units and
named periods, not adjectives
Chart exhibits
as drawn · not updated since
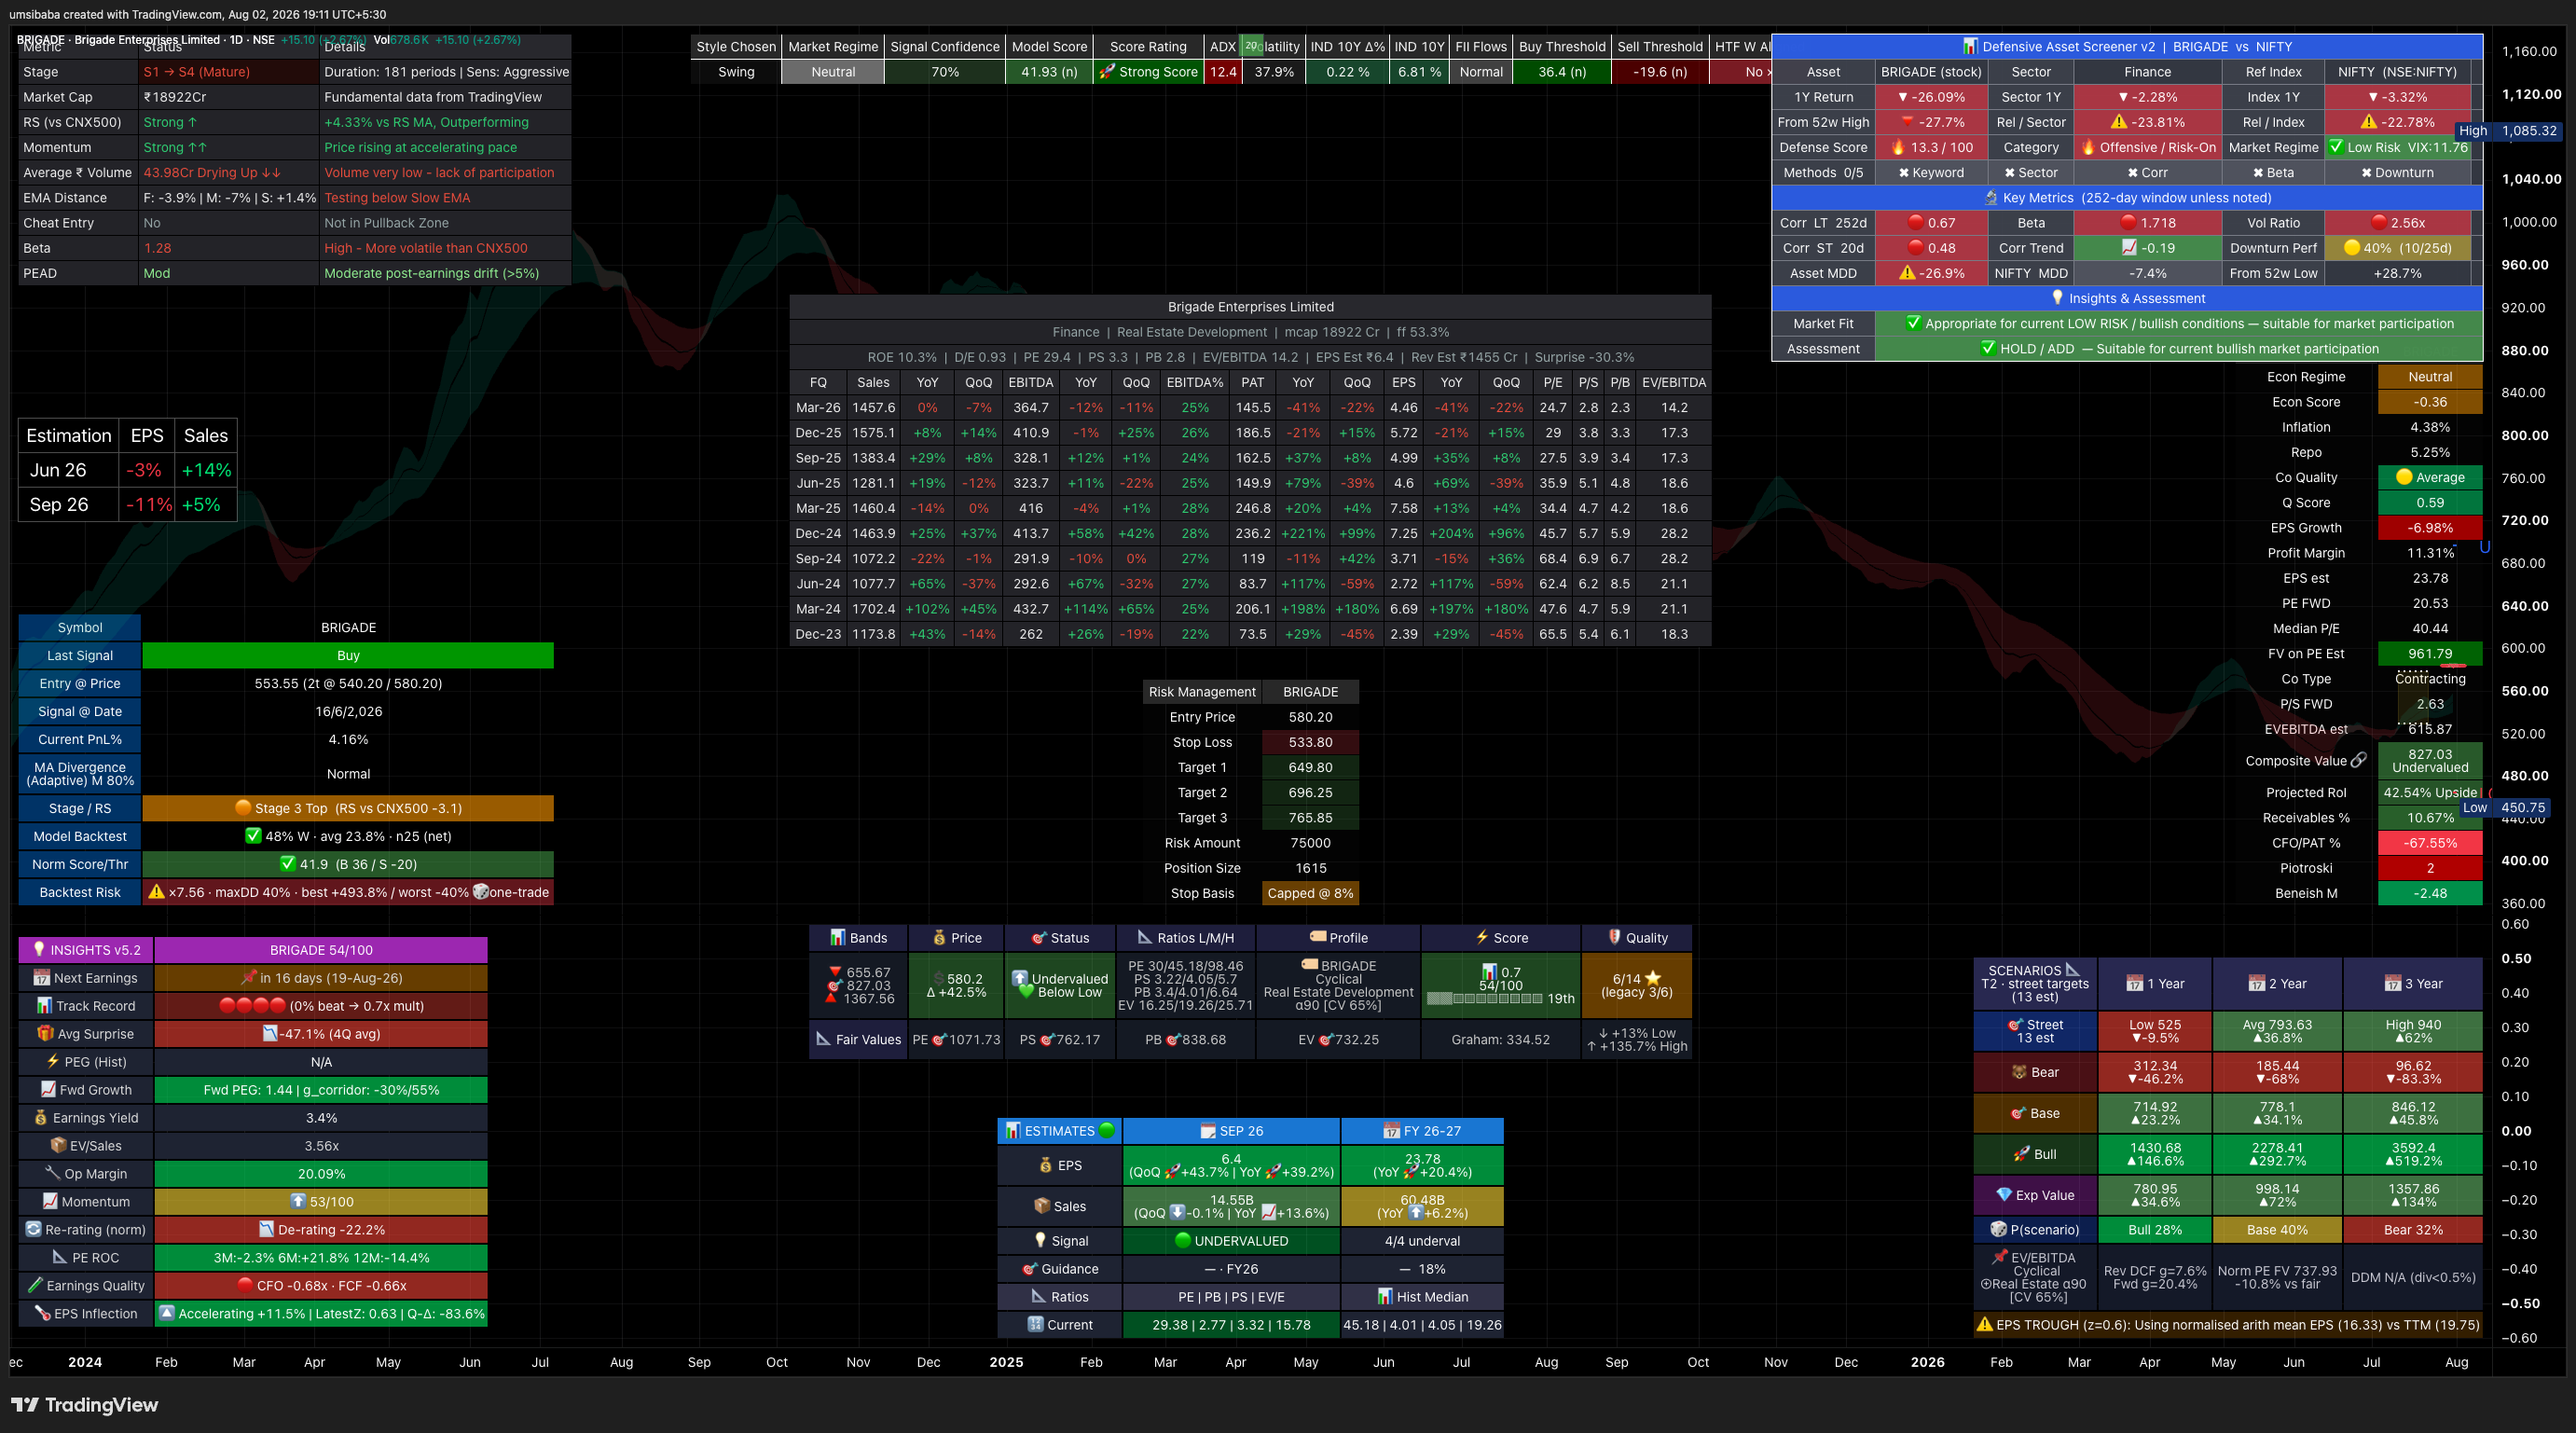
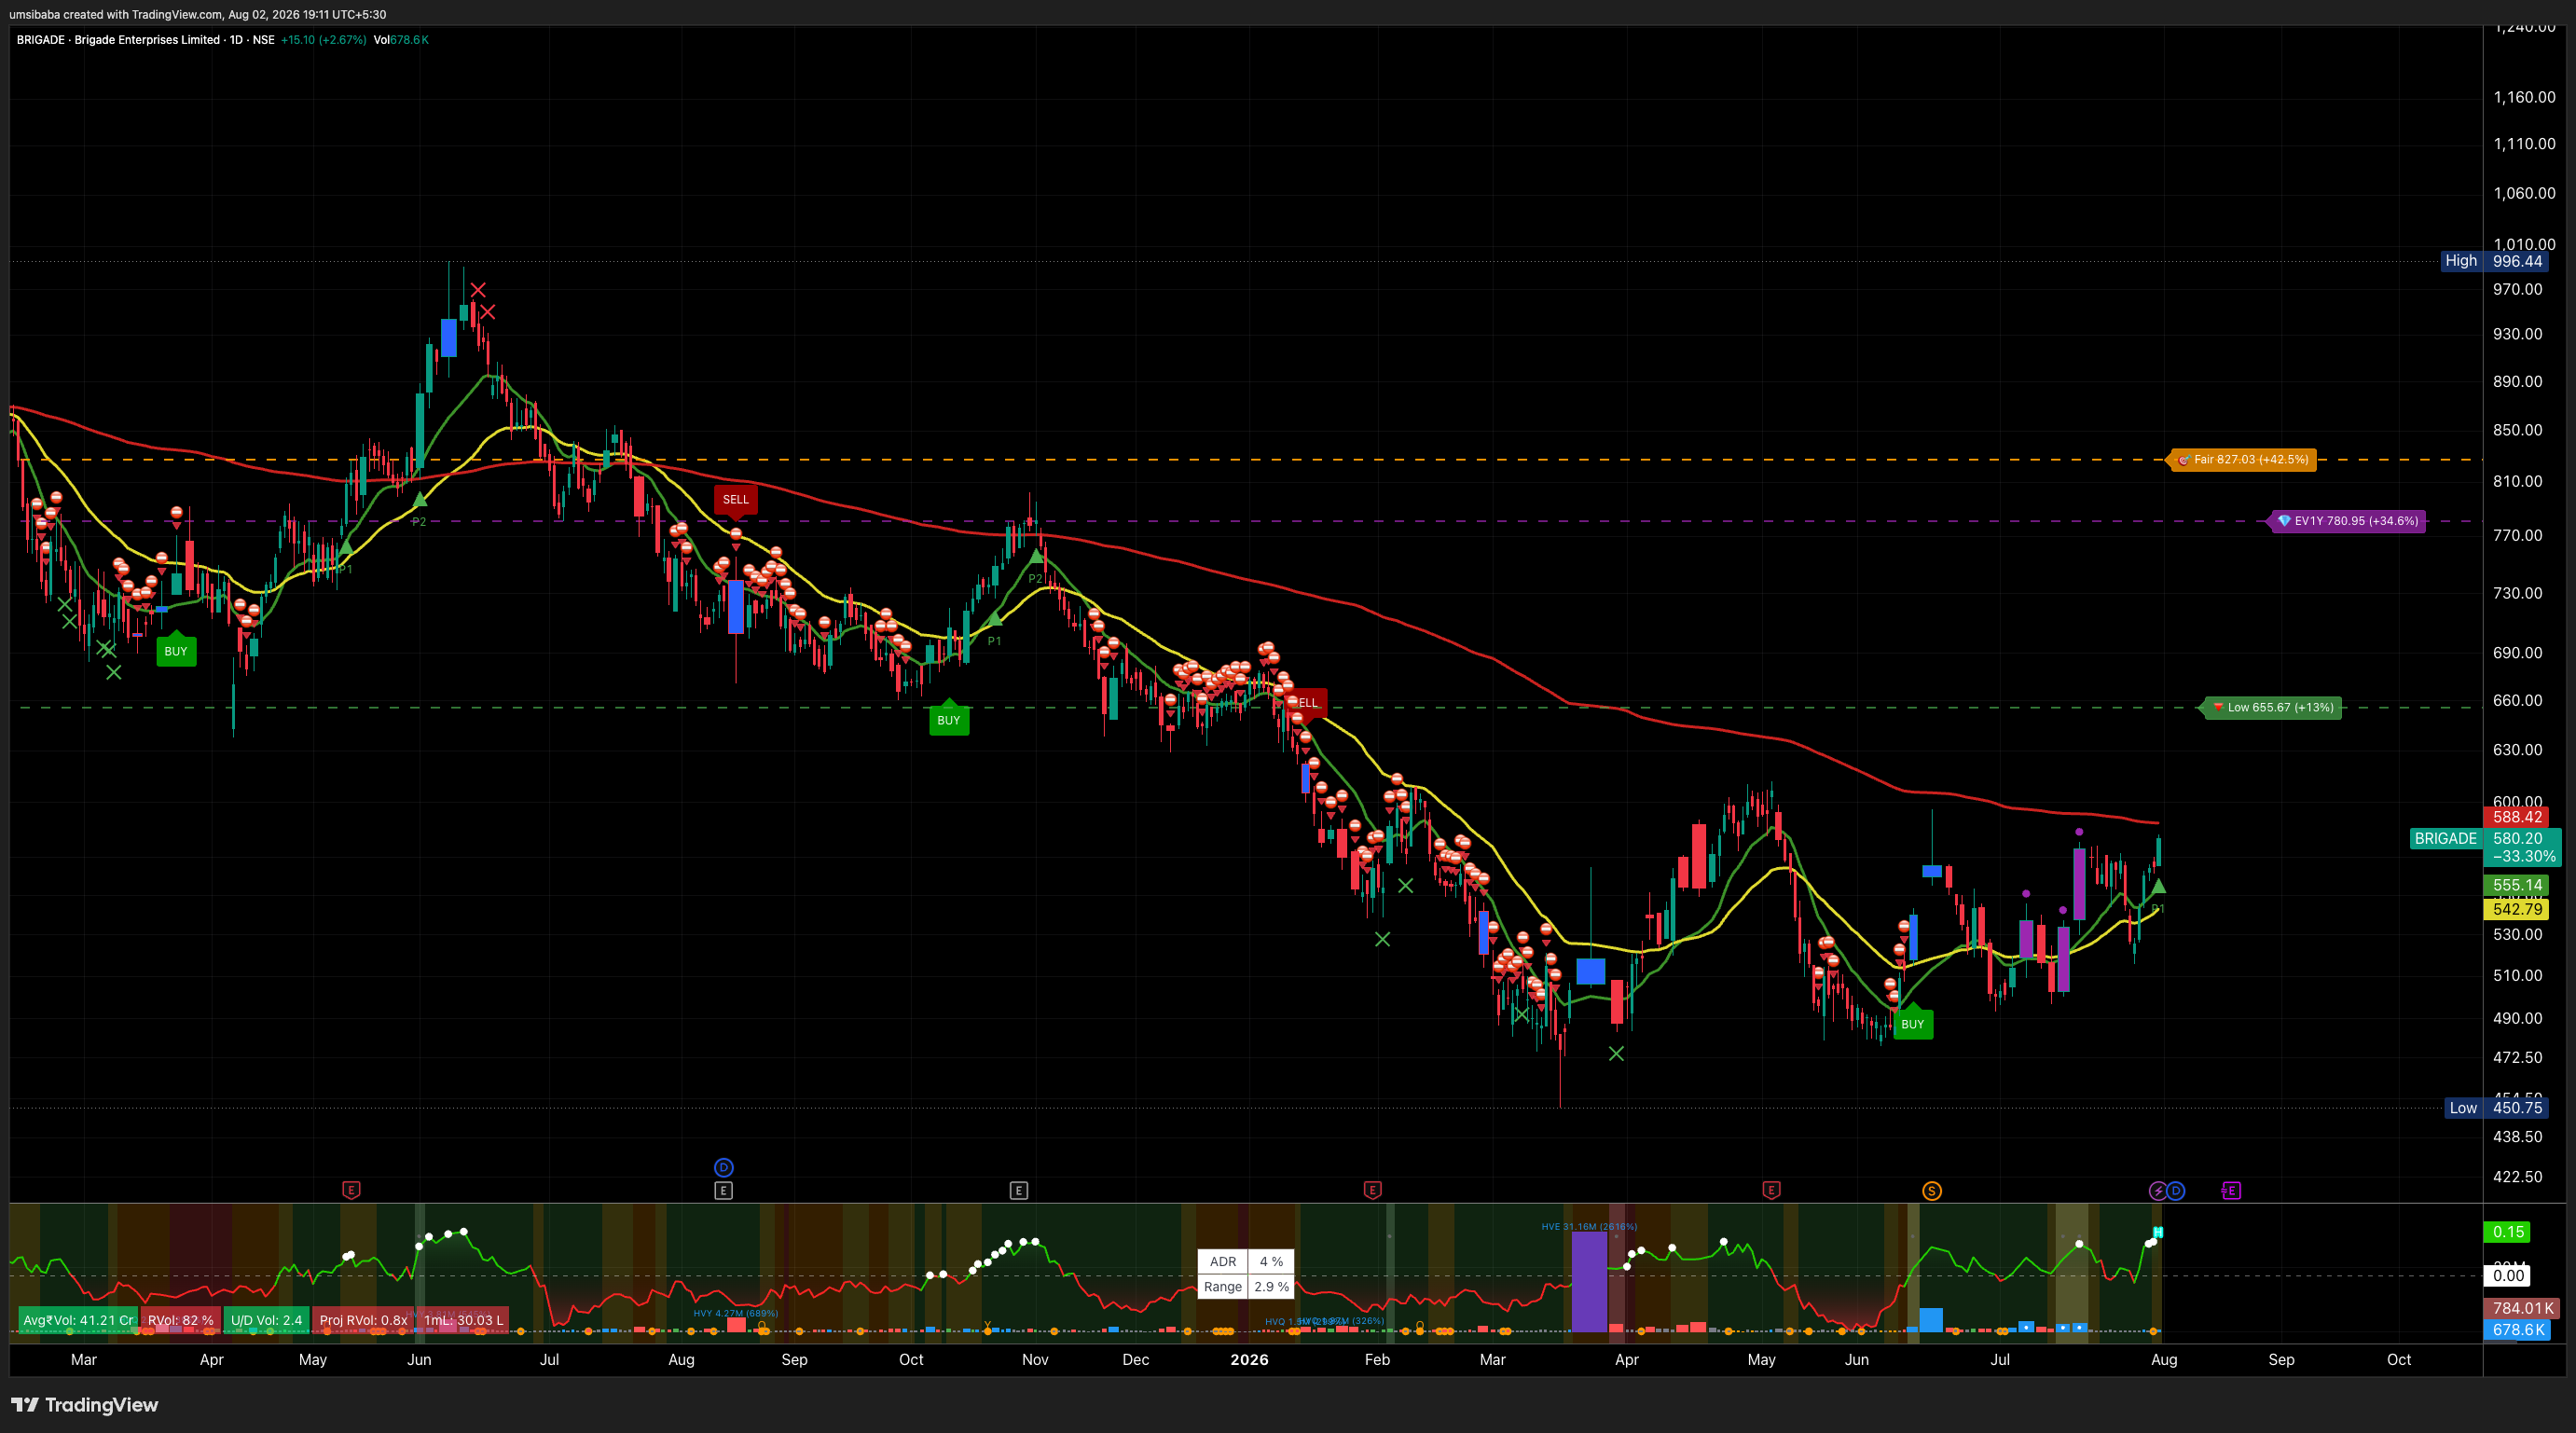
If management delivers what it guided
arithmetic on filed guidance and past valuations · not a price target
BRIGADE
FY26 → FY27 · 1 year of guidance · ~0.7 years from today₹580 today
BEAR
₹517
-11%
10.4% a year · 23.7x exit
BASE
₹763
+31%
18% a year · 32.7x exit
BULL
₹1,162
+100%
24.5% a year · 47.2x exit
Where the market has priced it
14x29x today145x
- the guided figure reached earnings through a low-confidence bridge
How these numbers are produced
| Earnings base | FY26 fiscal year EPS ₹19.76 (screener) |
|---|---|
| Guided growth | 18% a year, said on the call of 11-May-2026 · transcript |
| Read across as | operating: unlabelled growth figure, read as revenue — low confidence |
| Delivery calibration | 0.58x / 1x / 1.36x of what was guided — measured: 76 annual guided-vs-filed pairs + 77 near-complete quarterly years — NSE transcripts against the companies' own filings |
| Exit multiple | 23.7x / 32.7x / 47.25x, this company’s own p20 / median / p80 across 9 filed years |
| Filed-industry peers | median 29.49x across 21 peers — the cross-check, not the input |
| Arithmetic | base EPS × (1 + guided growth × delivery)1 × exit multiple |
Arithmetic on management’s own guidance and this company’s own past valuations. Not a price target, not a recommendation, and not a forecast of what the stock will do.
Price chart
260 sessions to 31 Jul 2026 ·
daily close ·
our own broker data