VIYASH
ViyashScientific
Latest view
—
as of 22 May 2026 · not a recommendation
Evidence timeline
What management said
from NSE earnings-call filings · extracted, not interpreted
guidance upgradedgeneric growth 15.0%ebitda growth 20.0%
So, when we say INR 185 crores this quarter, INR 187 crores last quarter, and also the topline is going to close to INR 900 crores, INR 860 odd crores or even if you take 15% growth we are pretty comfortable to reach that level, not e
Outlook, as stated
Of course, aspiration, I feel practically guys, 5 years 15%-20% CAGR is one thing, but when you see the spike it can go one year actually, you may like you have seen our EBITDA growth 50%-60% this quarter at 9months, we cannot expect 50%-60% EBITDA growth every year like that.
Earlier we indicated of course FY'27 we are going to achieve close to 20% but because of our initiatives last 3-4 quarters we are able to achieve now and we are very confident to maintain that 20%.
We can see that spikes while doing acquisition when there is opportunity but we are confident and we are targeting minimum of 15%-20% EBITDA growth, that's what we look at.
2.57
concrete references per 100 words spoken — counts, currency, units and
named periods, not adjectives
Chart exhibits
as drawn · not updated since
If management delivers what it guided
arithmetic on filed guidance and past valuations · not a price target
VIYASH
FY26 → FY28 · 2 years of guidance · ~1.7 years from today₹252 today
BEAR
₹173
-31%-20% a yr
8.7% a year · 36.1x exit
BASE
₹307
+22%+13% a yr
15% a year · 57.2x exit
BULL
₹699
+178%+85% a yr
20.4% a year · 118.8x exit
Where the market has priced it
4x62x today146x
- FY26 earnings of Rs 4.06 sit 4x the prior year (Rs 0.93) and 4x the median of the years before it — a discontinuity, not a run-rate this projection can assume continues
- the guided figure reached earnings through a low-confidence bridge
- the last 2 years priced this company 69% above its ten-year median (97x vs 57x) — the exit multiple here is the ten-year one, so a sustained re-rating would not be captured
- this company's own median multiple sits 101% above its filed-industry peers; the scenario uses its own
How these numbers are produced
| Earnings base | FY26 fiscal year EPS ₹4.06 (screener) |
|---|---|
| Guided growth | 15% a year, said on the call of 09-Feb-2026 · transcript |
| Read across as | operating: unlabelled growth figure, read as revenue — low confidence |
| Delivery calibration | 0.58x / 1x / 1.36x of what was guided — measured: 76 annual guided-vs-filed pairs + 77 near-complete quarterly years — NSE transcripts against the companies' own filings |
| Exit multiple | 36.15x / 57.21x / 118.84x, this company’s own p20 / median / p80 across 7 filed years |
| Filed-industry peers | median 28.43x across 38 peers — the cross-check, not the input |
| Arithmetic | base EPS × (1 + guided growth × delivery)2 × exit multiple |
Arithmetic on management’s own guidance and this company’s own past valuations. Not a price target, not a recommendation, and not a forecast of what the stock will do.
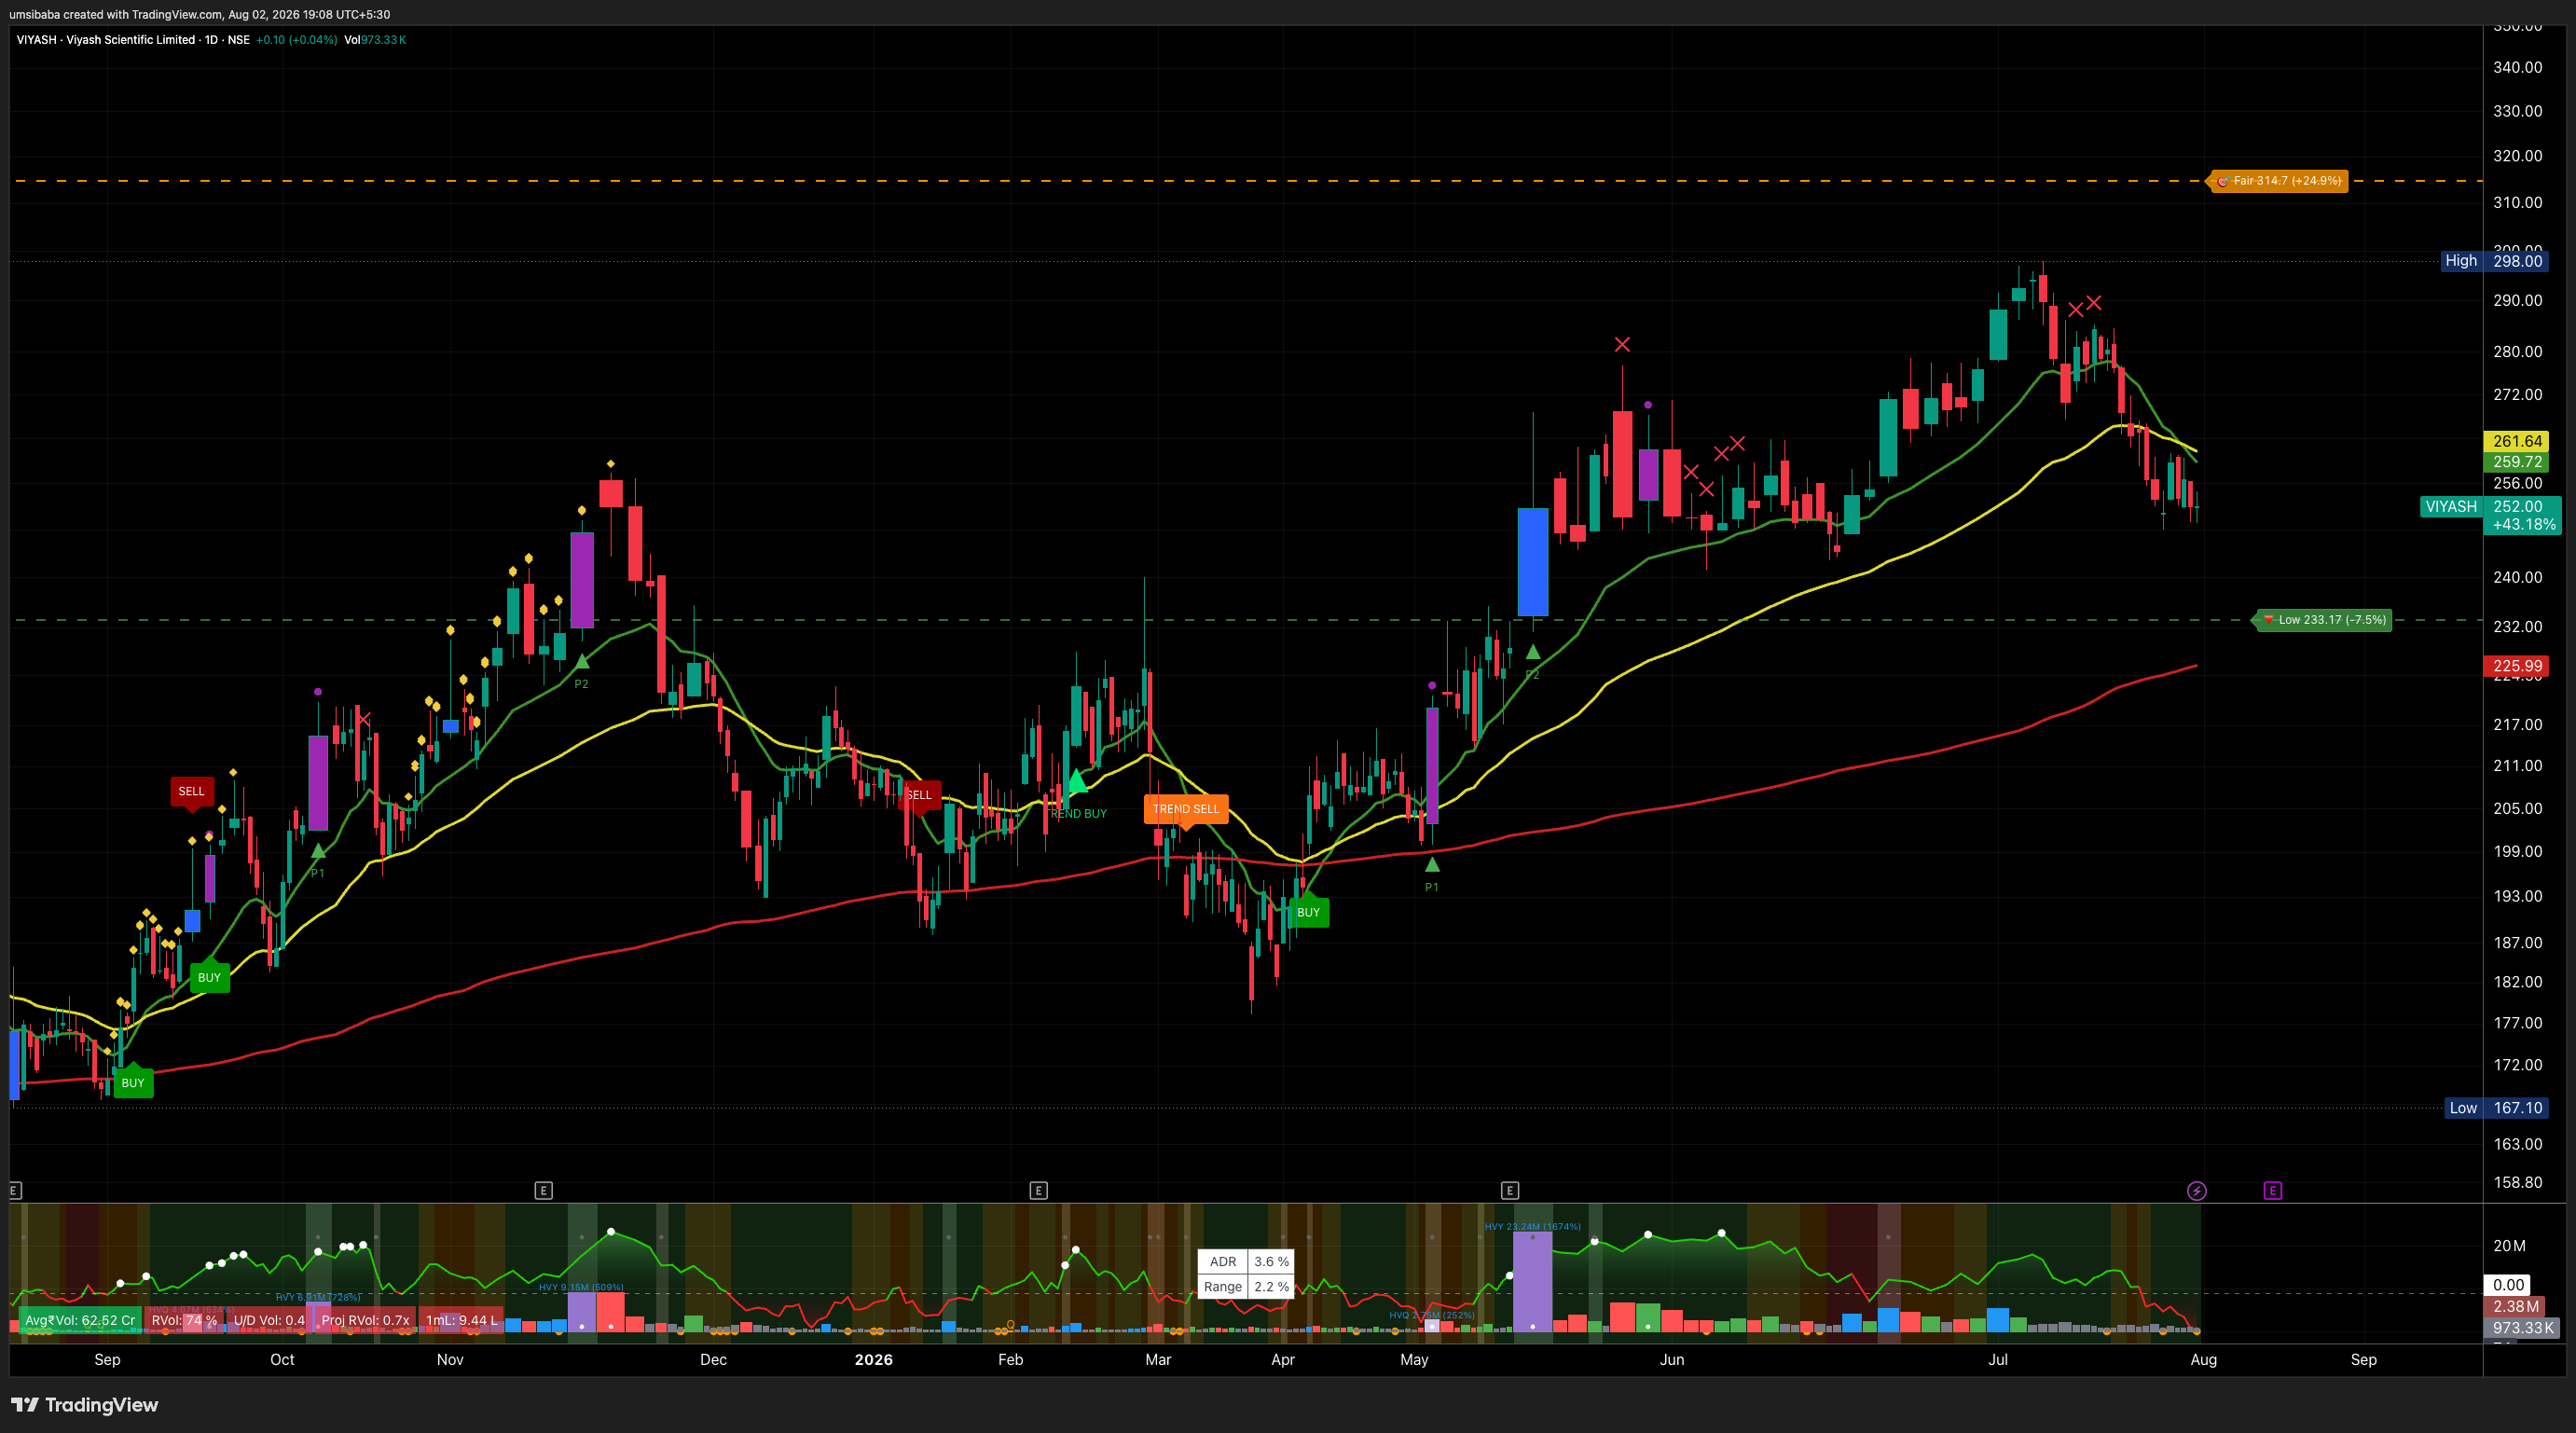
Price chart
260 sessions to 31 Jul 2026 ·
daily close ·
our own broker data