SEALMATIC
Sealmatic India Ltd (BSE:543782)
Latest view
Neutral
as of 1 Jun 2026 · not a recommendation
Evidence timeline
What management said
from NSE earnings-call filings · extracted, not interpreted
generic growth 15.0%
Umar Balwa: We expect to grow by 15% this year.
Call 01-Jun-2026 · transcript PDF
Outlook, as stated
For the financial year 2025, Sealmatic has achieved a yearon-year organic order intake growth of 25%, which shall also lead to seamless operations, which will enhance profitability and increase in the top line.
Our sales turnover for FY25-'26 stood at INR103 crores compared to the previous year of INR101 crores, reflecting a growth of 2% year-on-year.
Umar Balwa: For next year, say 900, we expect to add for FY27, say about 300 seals more on the API.
2.82
concrete references per 100 words spoken — counts, currency, units and
named periods, not adjectives
Chart exhibits
as drawn · not updated since
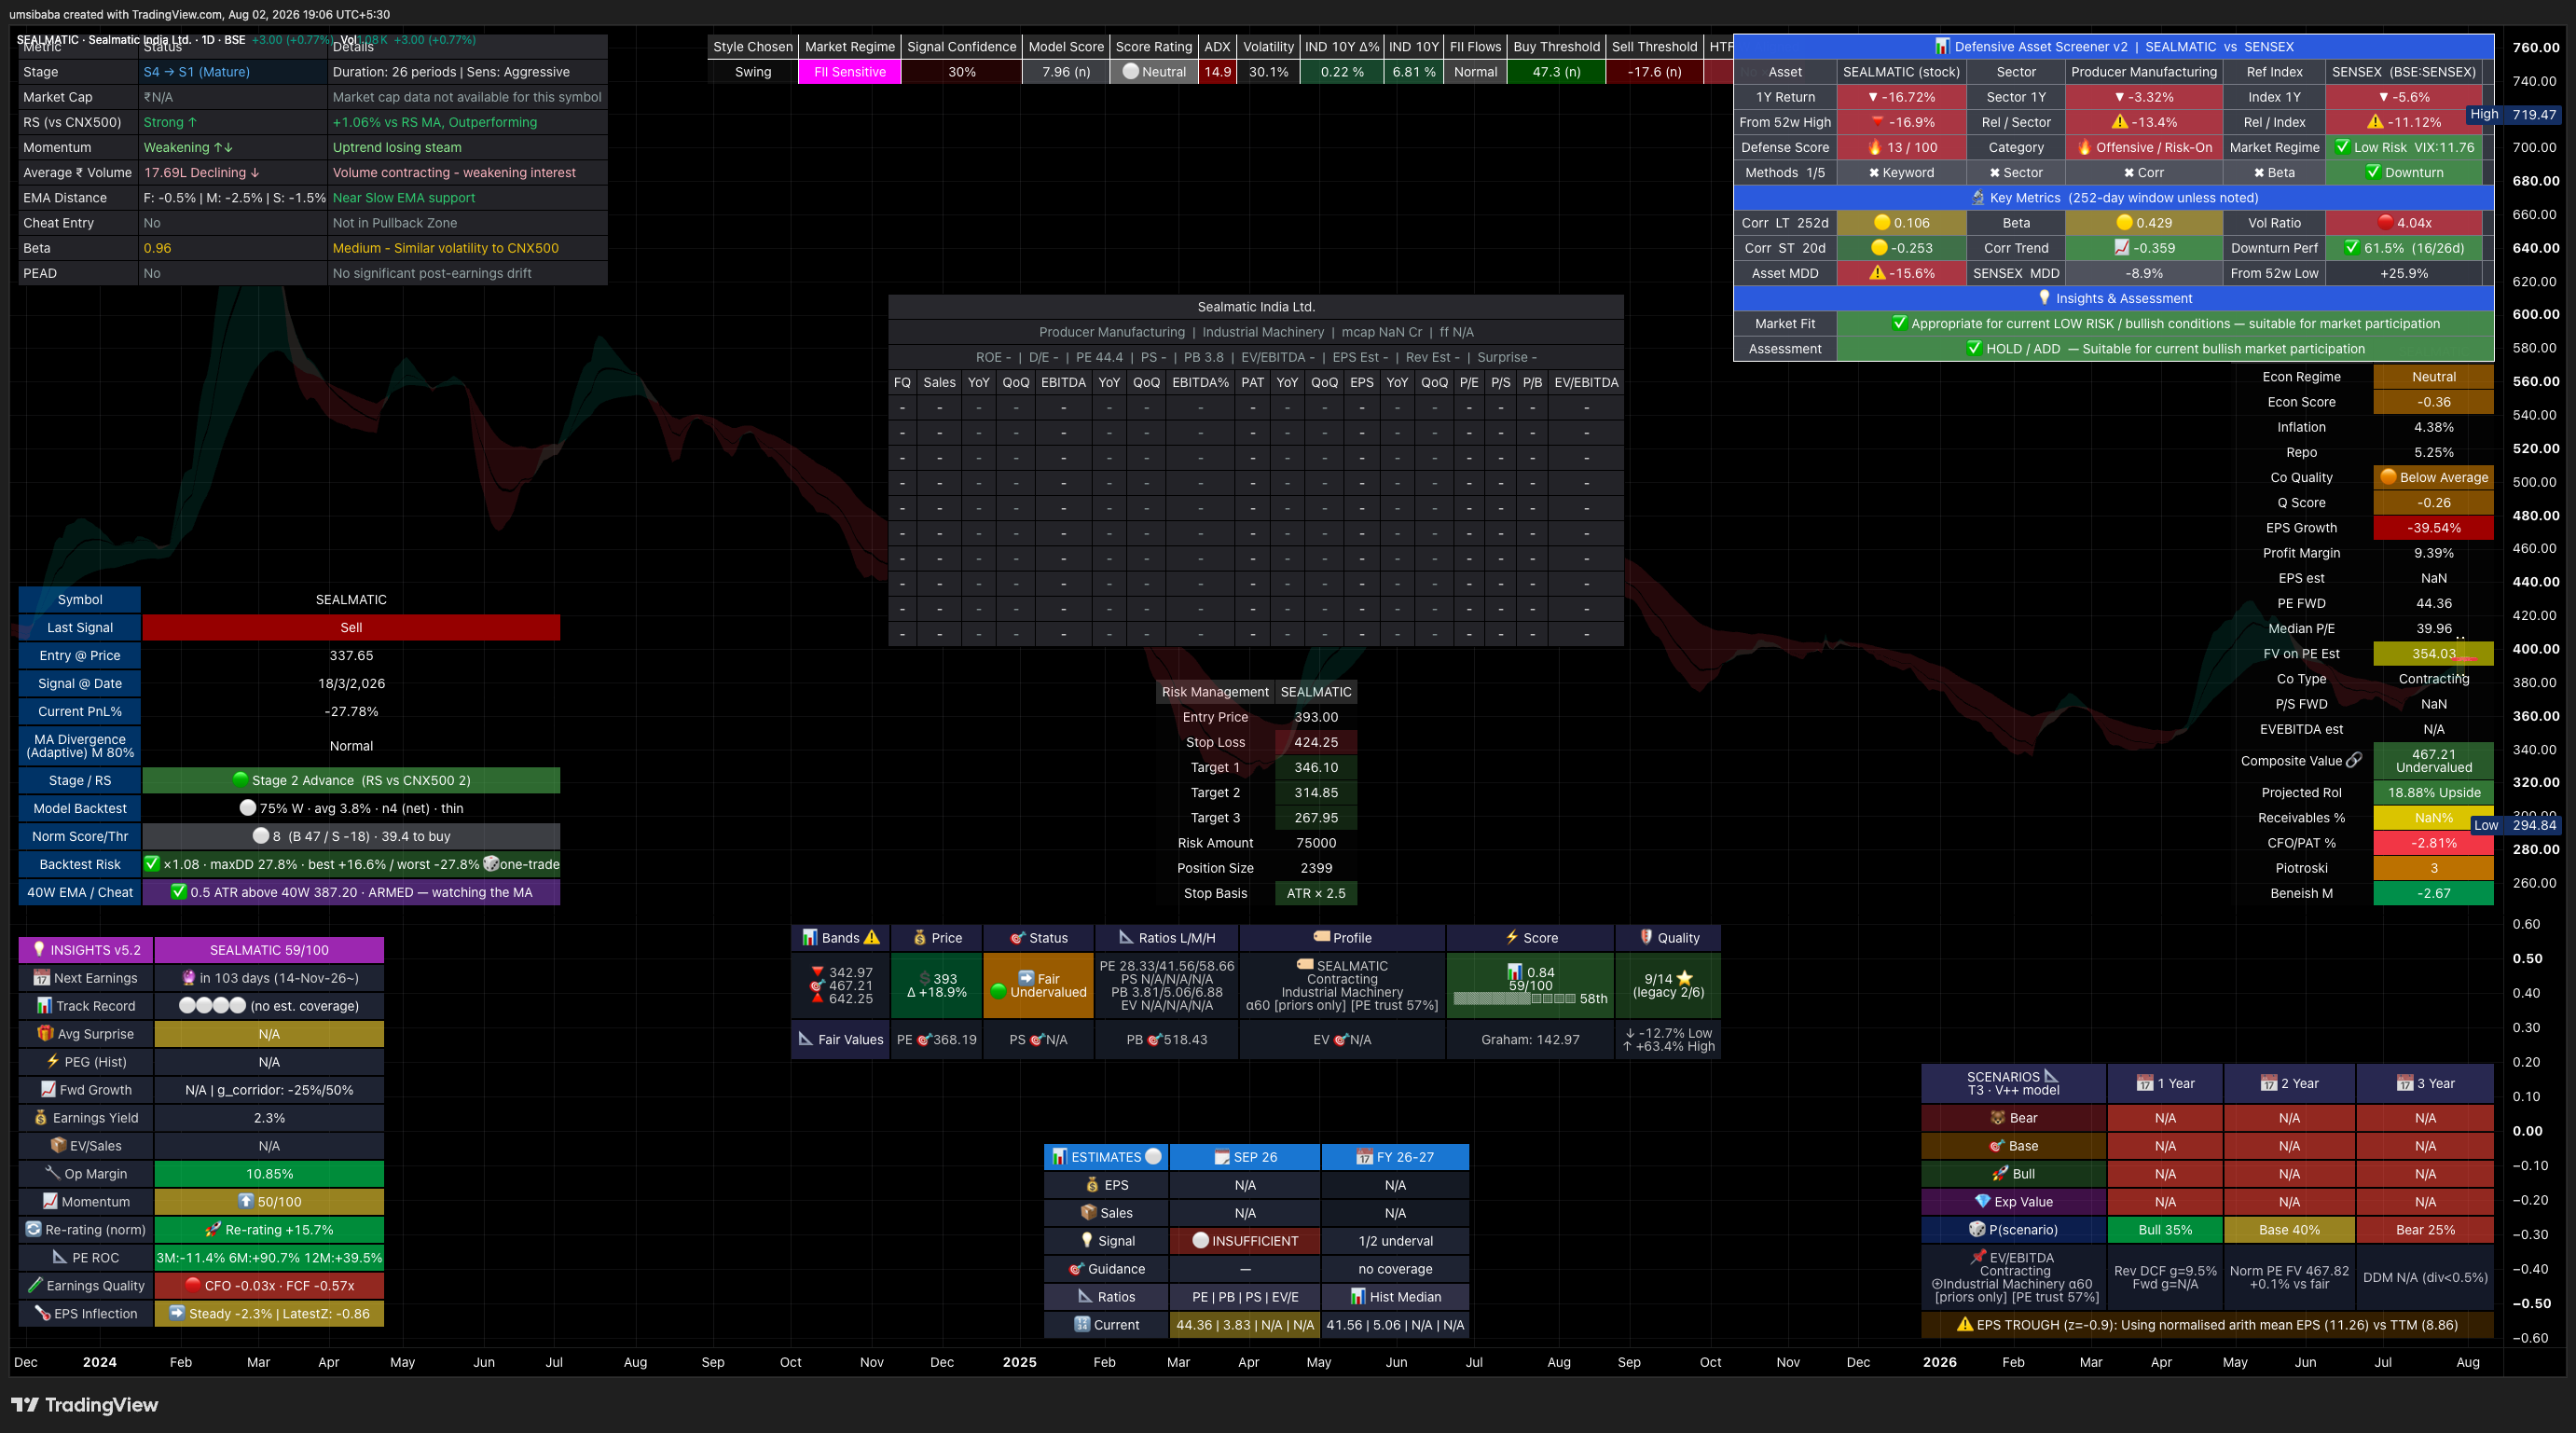
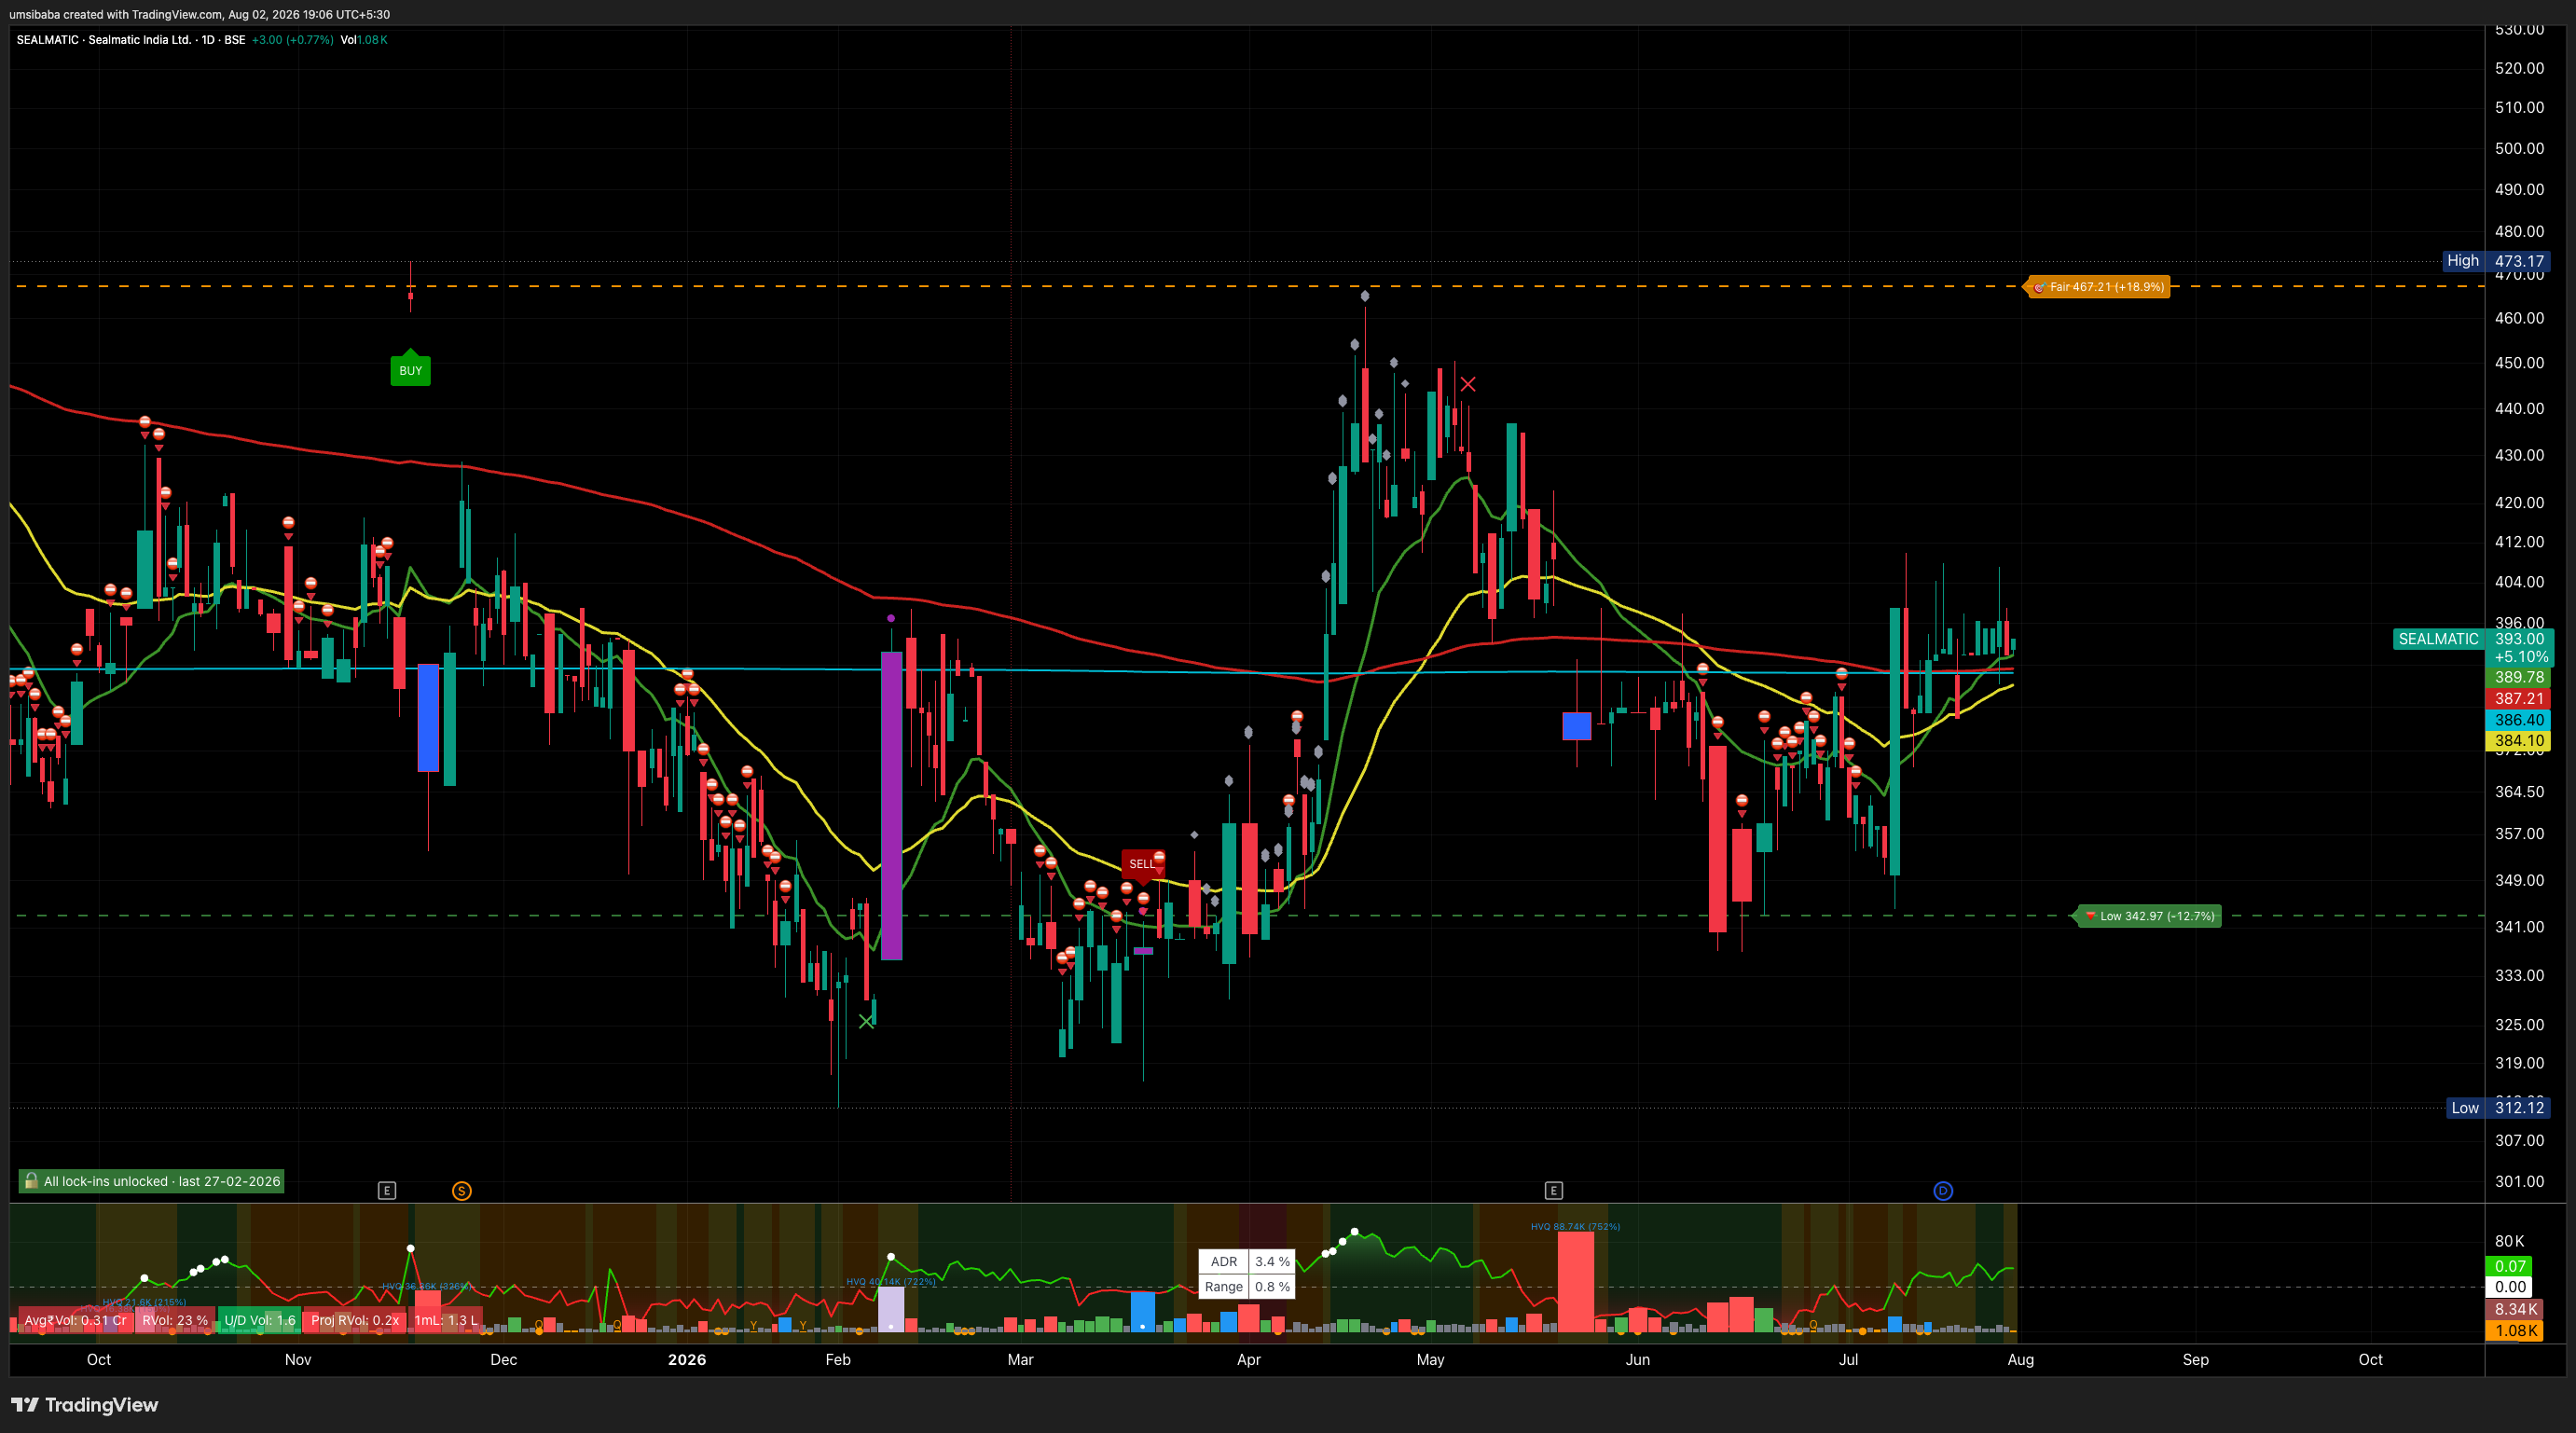
If management delivers what it guided
arithmetic on filed guidance and past valuations · not a price target
SEALMATIC
FY26 → FY27 · 1 year of guidance · ~0.7 years from today₹393 today
BEAR
₹183
-54%
8.7% a year · 17.7x exit
BASE
₹308
-22%
15% a year · 28.2x exit
BULL
₹697
+77%
20.4% a year · 61x exit
Where the market has priced it
7x41x today95x
- the guided figure reached earnings through a low-confidence bridge
- this company has too little filed history for a multiple band of its own, so the exit multiple is the median of 31 Industrial Machinery peers
How these numbers are produced
| Earnings base | FY26 fiscal year EPS ₹9.5 (screener) |
|---|---|
| Guided growth | 15% a year, said on the call of 01-Jun-2026 · transcript |
| Read across as | operating: unlabelled growth figure, read as revenue — low confidence |
| Delivery calibration | 0.58x / 1x / 1.36x of what was guided — measured: 76 annual guided-vs-filed pairs + 77 near-complete quarterly years — NSE transcripts against the companies' own filings |
| Exit multiple | 17.71x / 28.23x / 61x, this company’s own p20 / median / p80 across 31 filed years |
| Filed-industry peers | median 28.23x across 31 peers — the cross-check, not the input |
| Arithmetic | base EPS × (1 + guided growth × delivery)1 × exit multiple |
Arithmetic on management’s own guidance and this company’s own past valuations. Not a price target, not a recommendation, and not a forecast of what the stock will do.
Price chart
260 sessions to 31 Jul 2026 ·
daily close ·
our own broker data