MTar Technologies (MTARTECH)
Evidence timeline
2026
2026
What management said
And having confidence in the execution of orders on hand, we are raising our guidance for FY '27 from 50% revenue growth to 80% plus - revenue growth, plus/minus 5%, with clear EBITDA margins of around 24% for the year, mainly due
Pace against its own guidance
Outlook, as stated
Srinivas Reddy: No, I've said we are based on the kind of requirements by the various customers that we have and the latest inputs that we have, it is very clear that we have the guidanceearlier we mentioned as 50% of revenue growth, but now it will be around 80%, plus/minus 5%, around that area.
In addition, we have received around INR140 crores of orders last week and the company will be receiving further orders during the current financial year for the various requirements of the Clean Energy segment, especially with Bloom Energy as well.
Accordingly, the company has recorded revenues of INR387 crores in the Clean Energy Fuel Cell segment alone during the first 9 months of the fiscal year and expect to deliver revenues of INR250 crores by end of the current fiscal year in Q4.
Chart exhibits
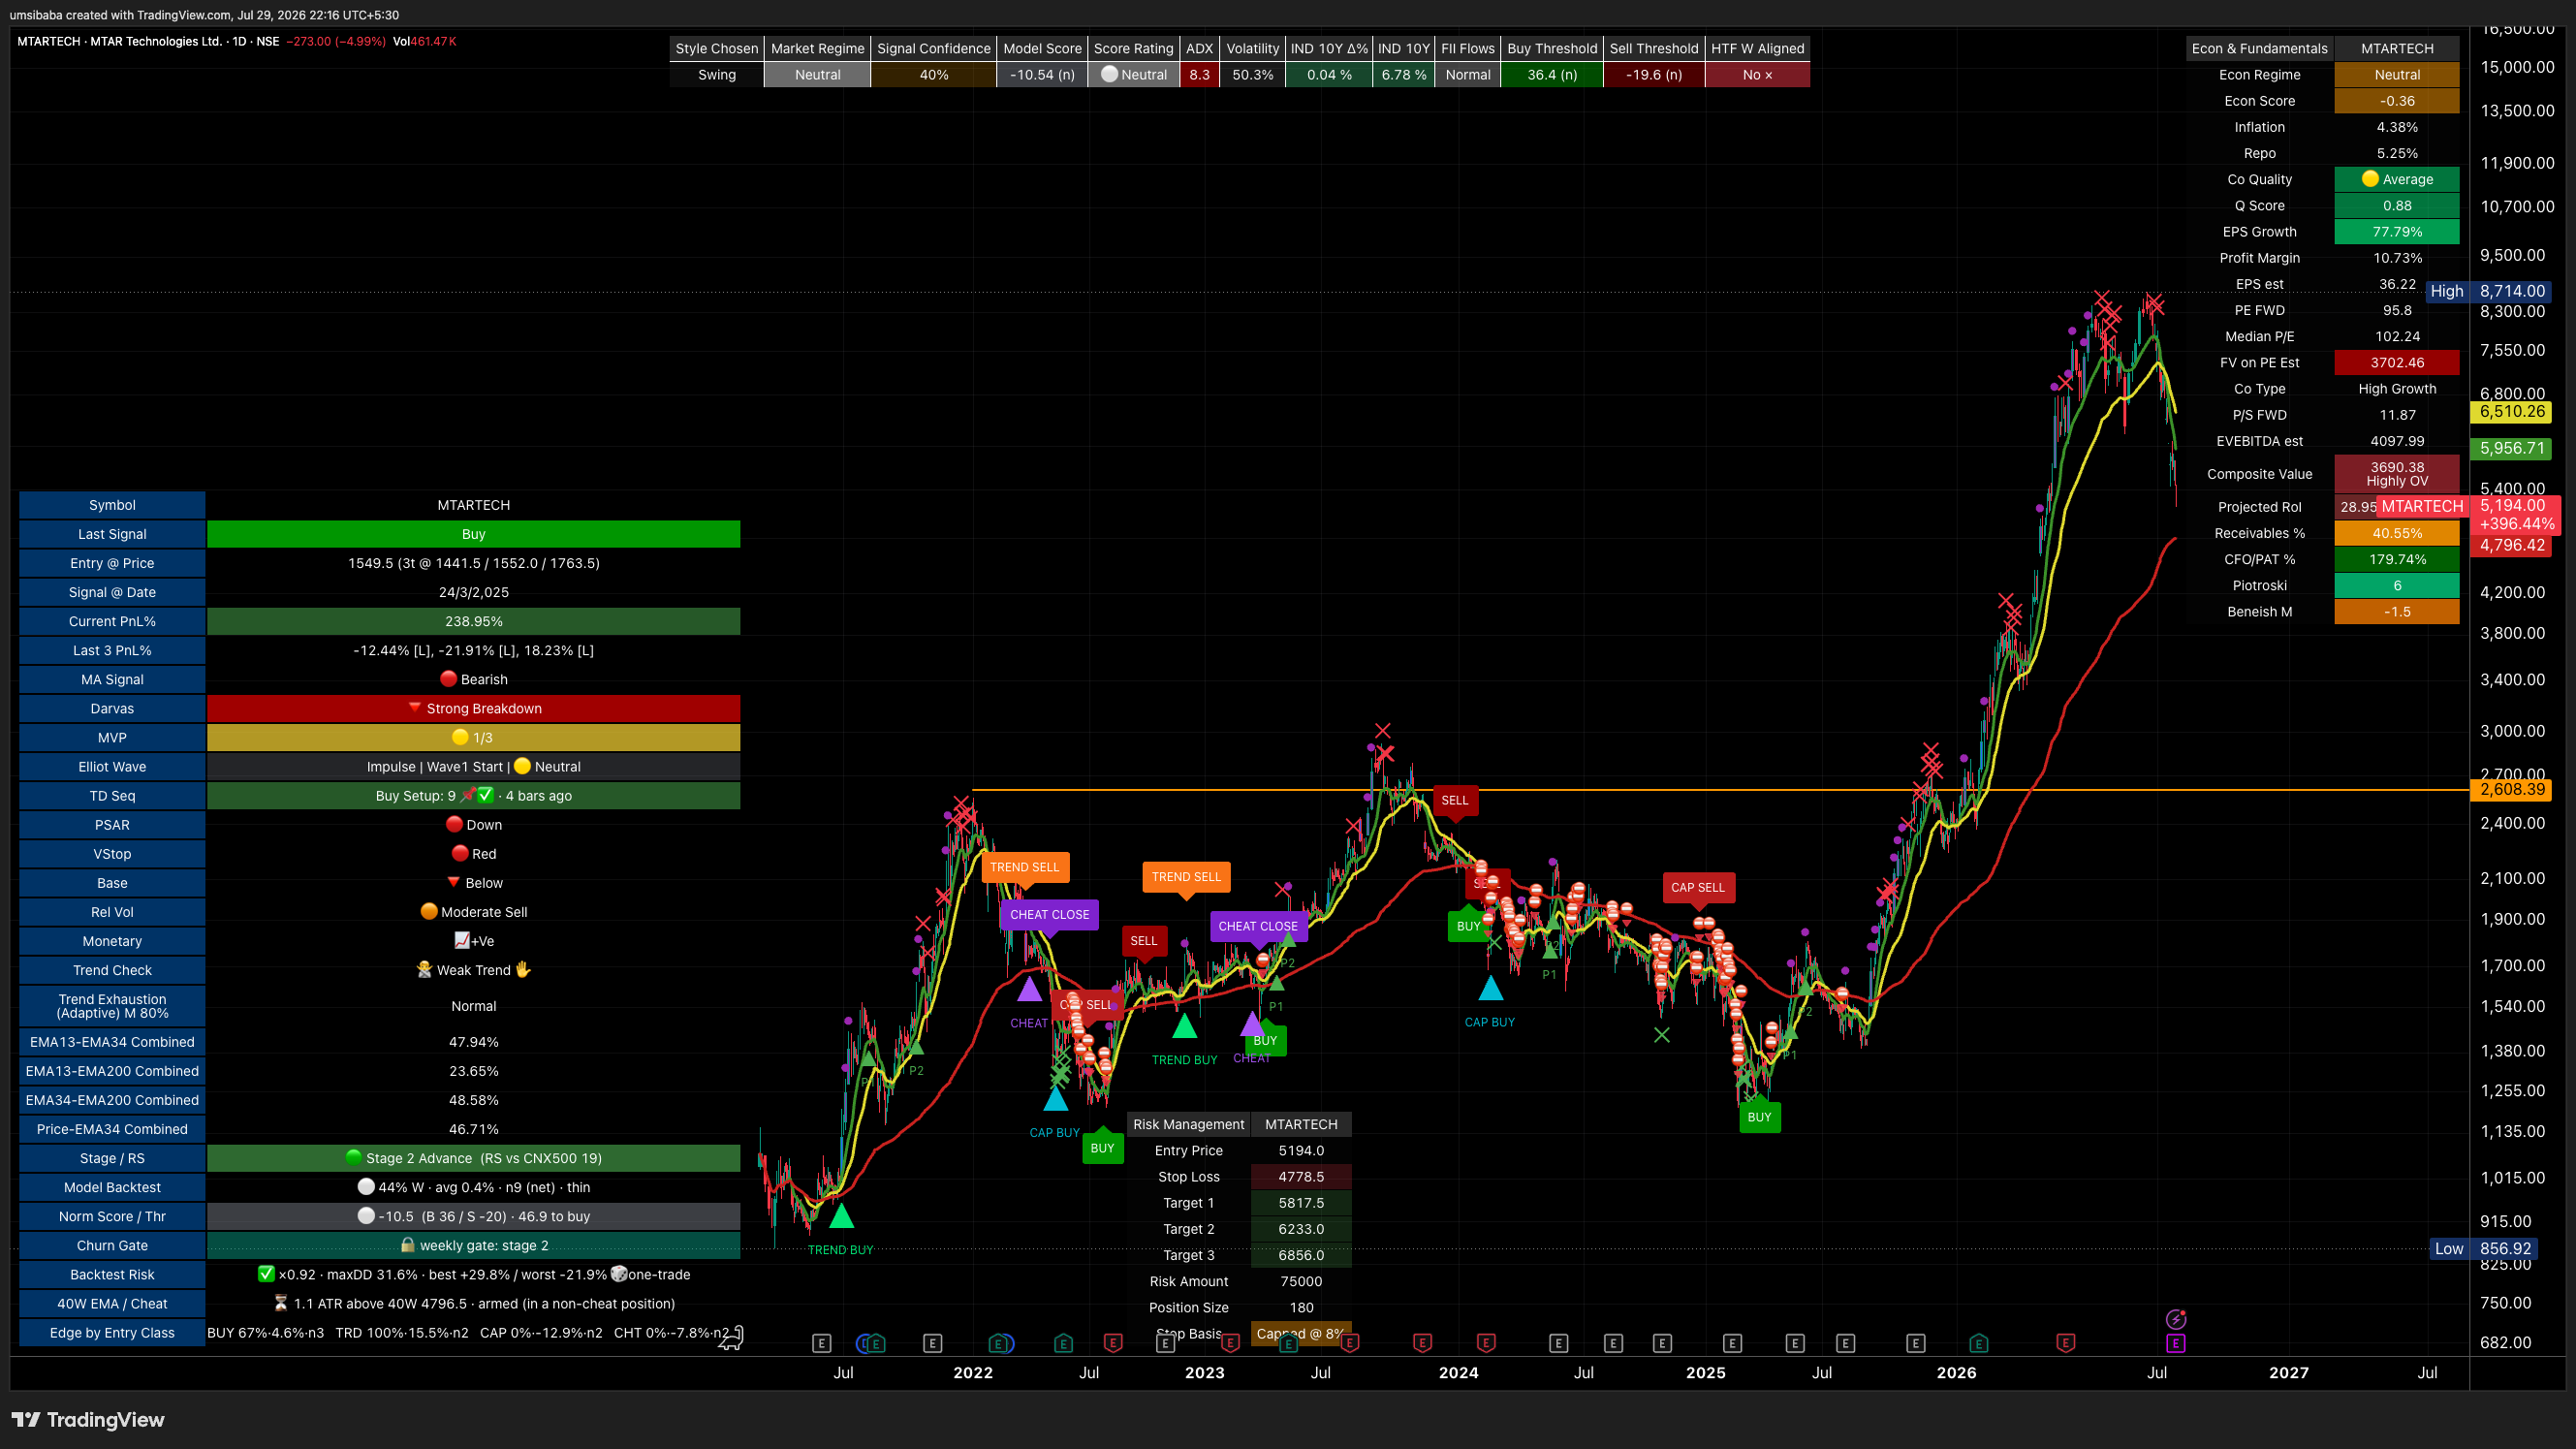
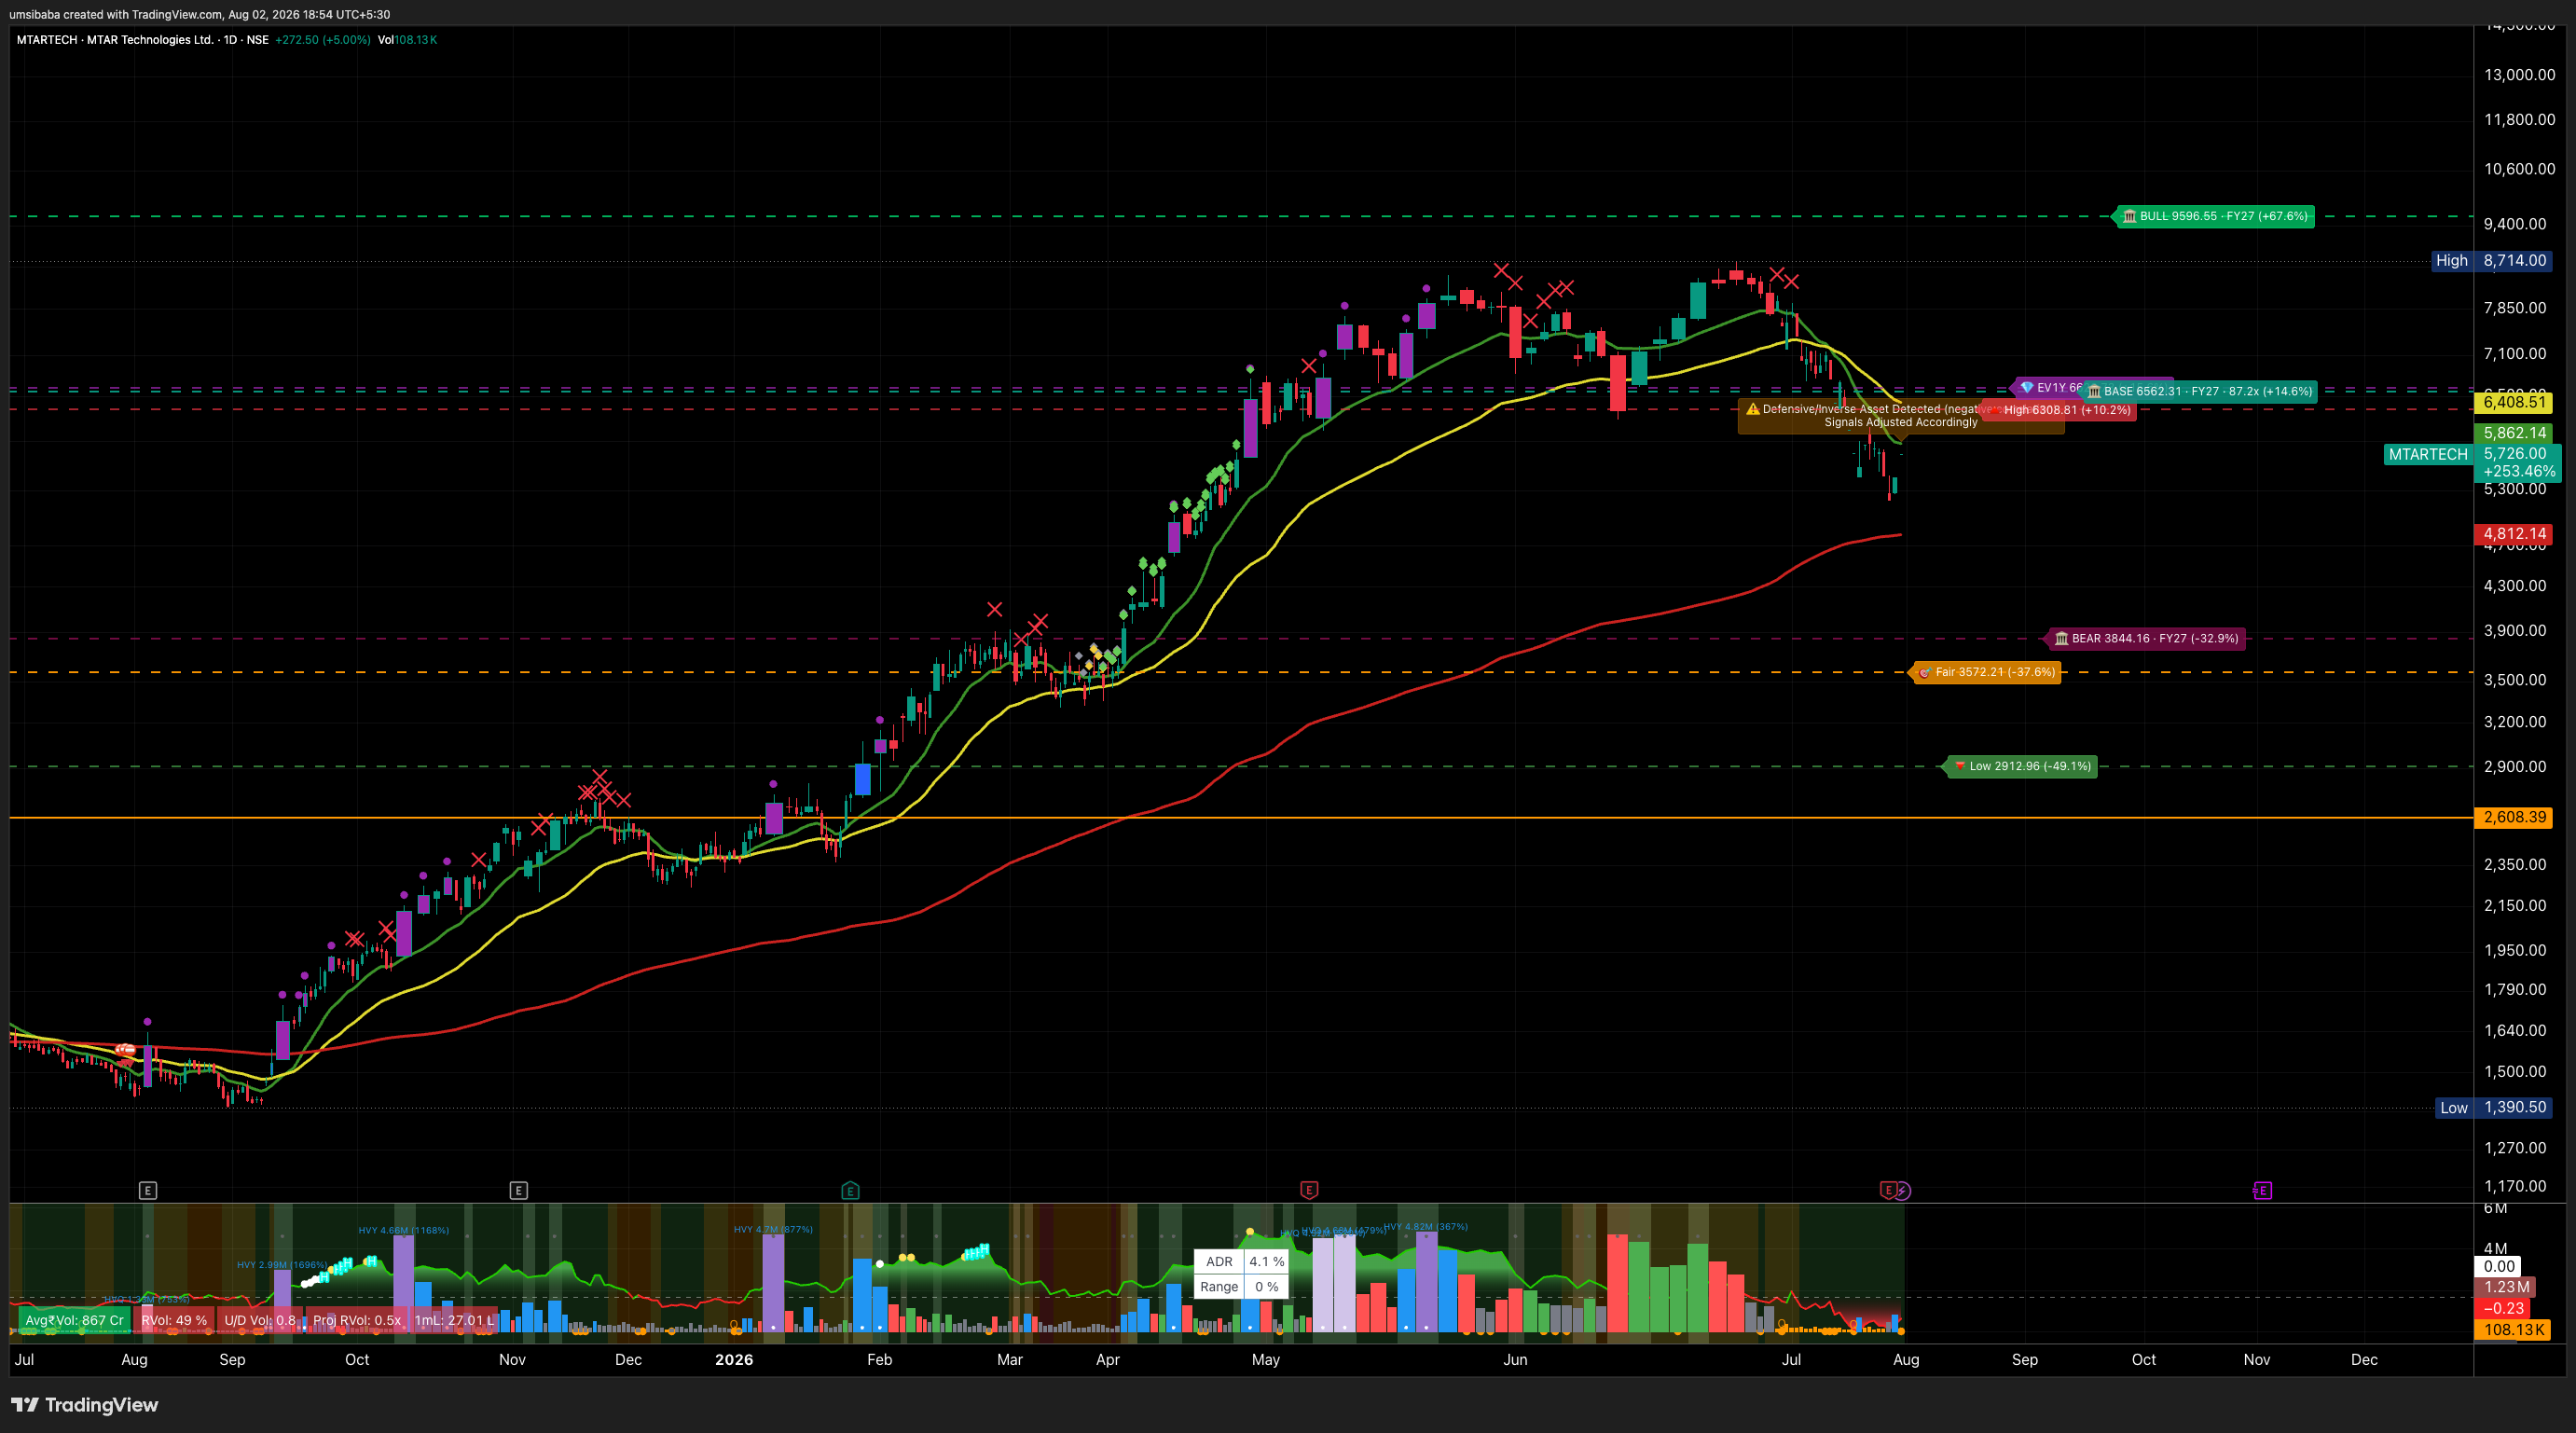
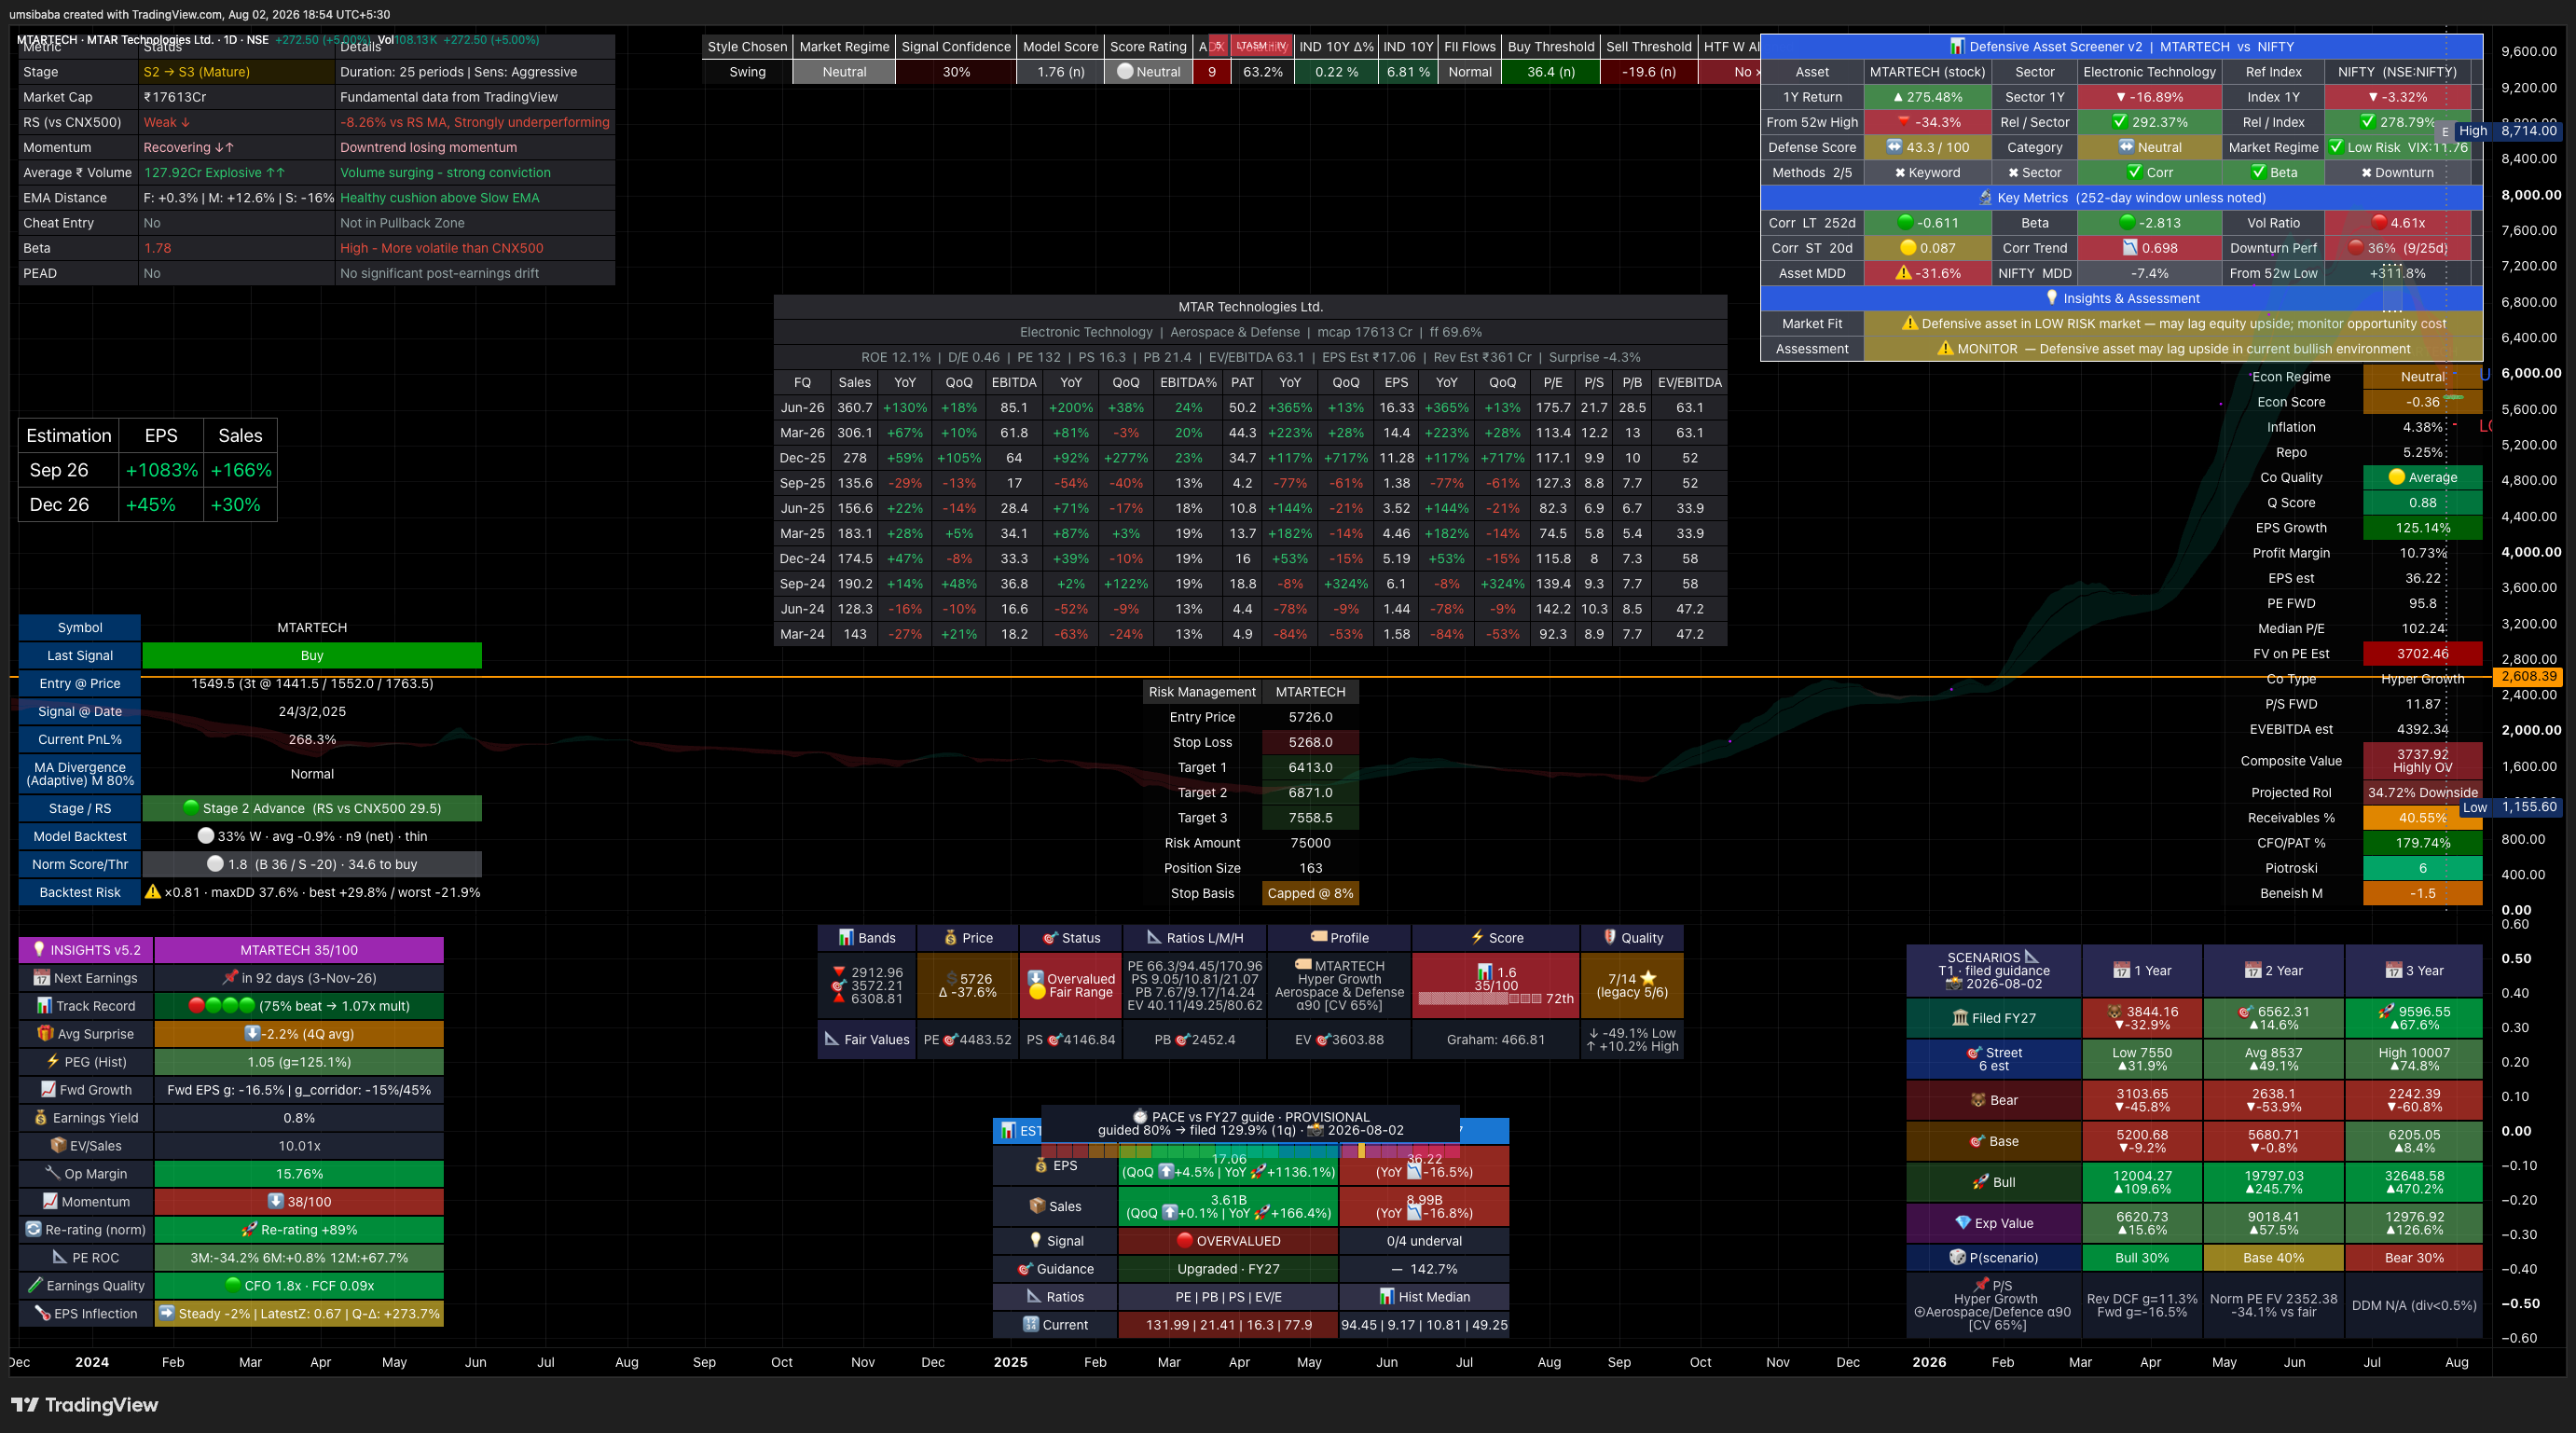
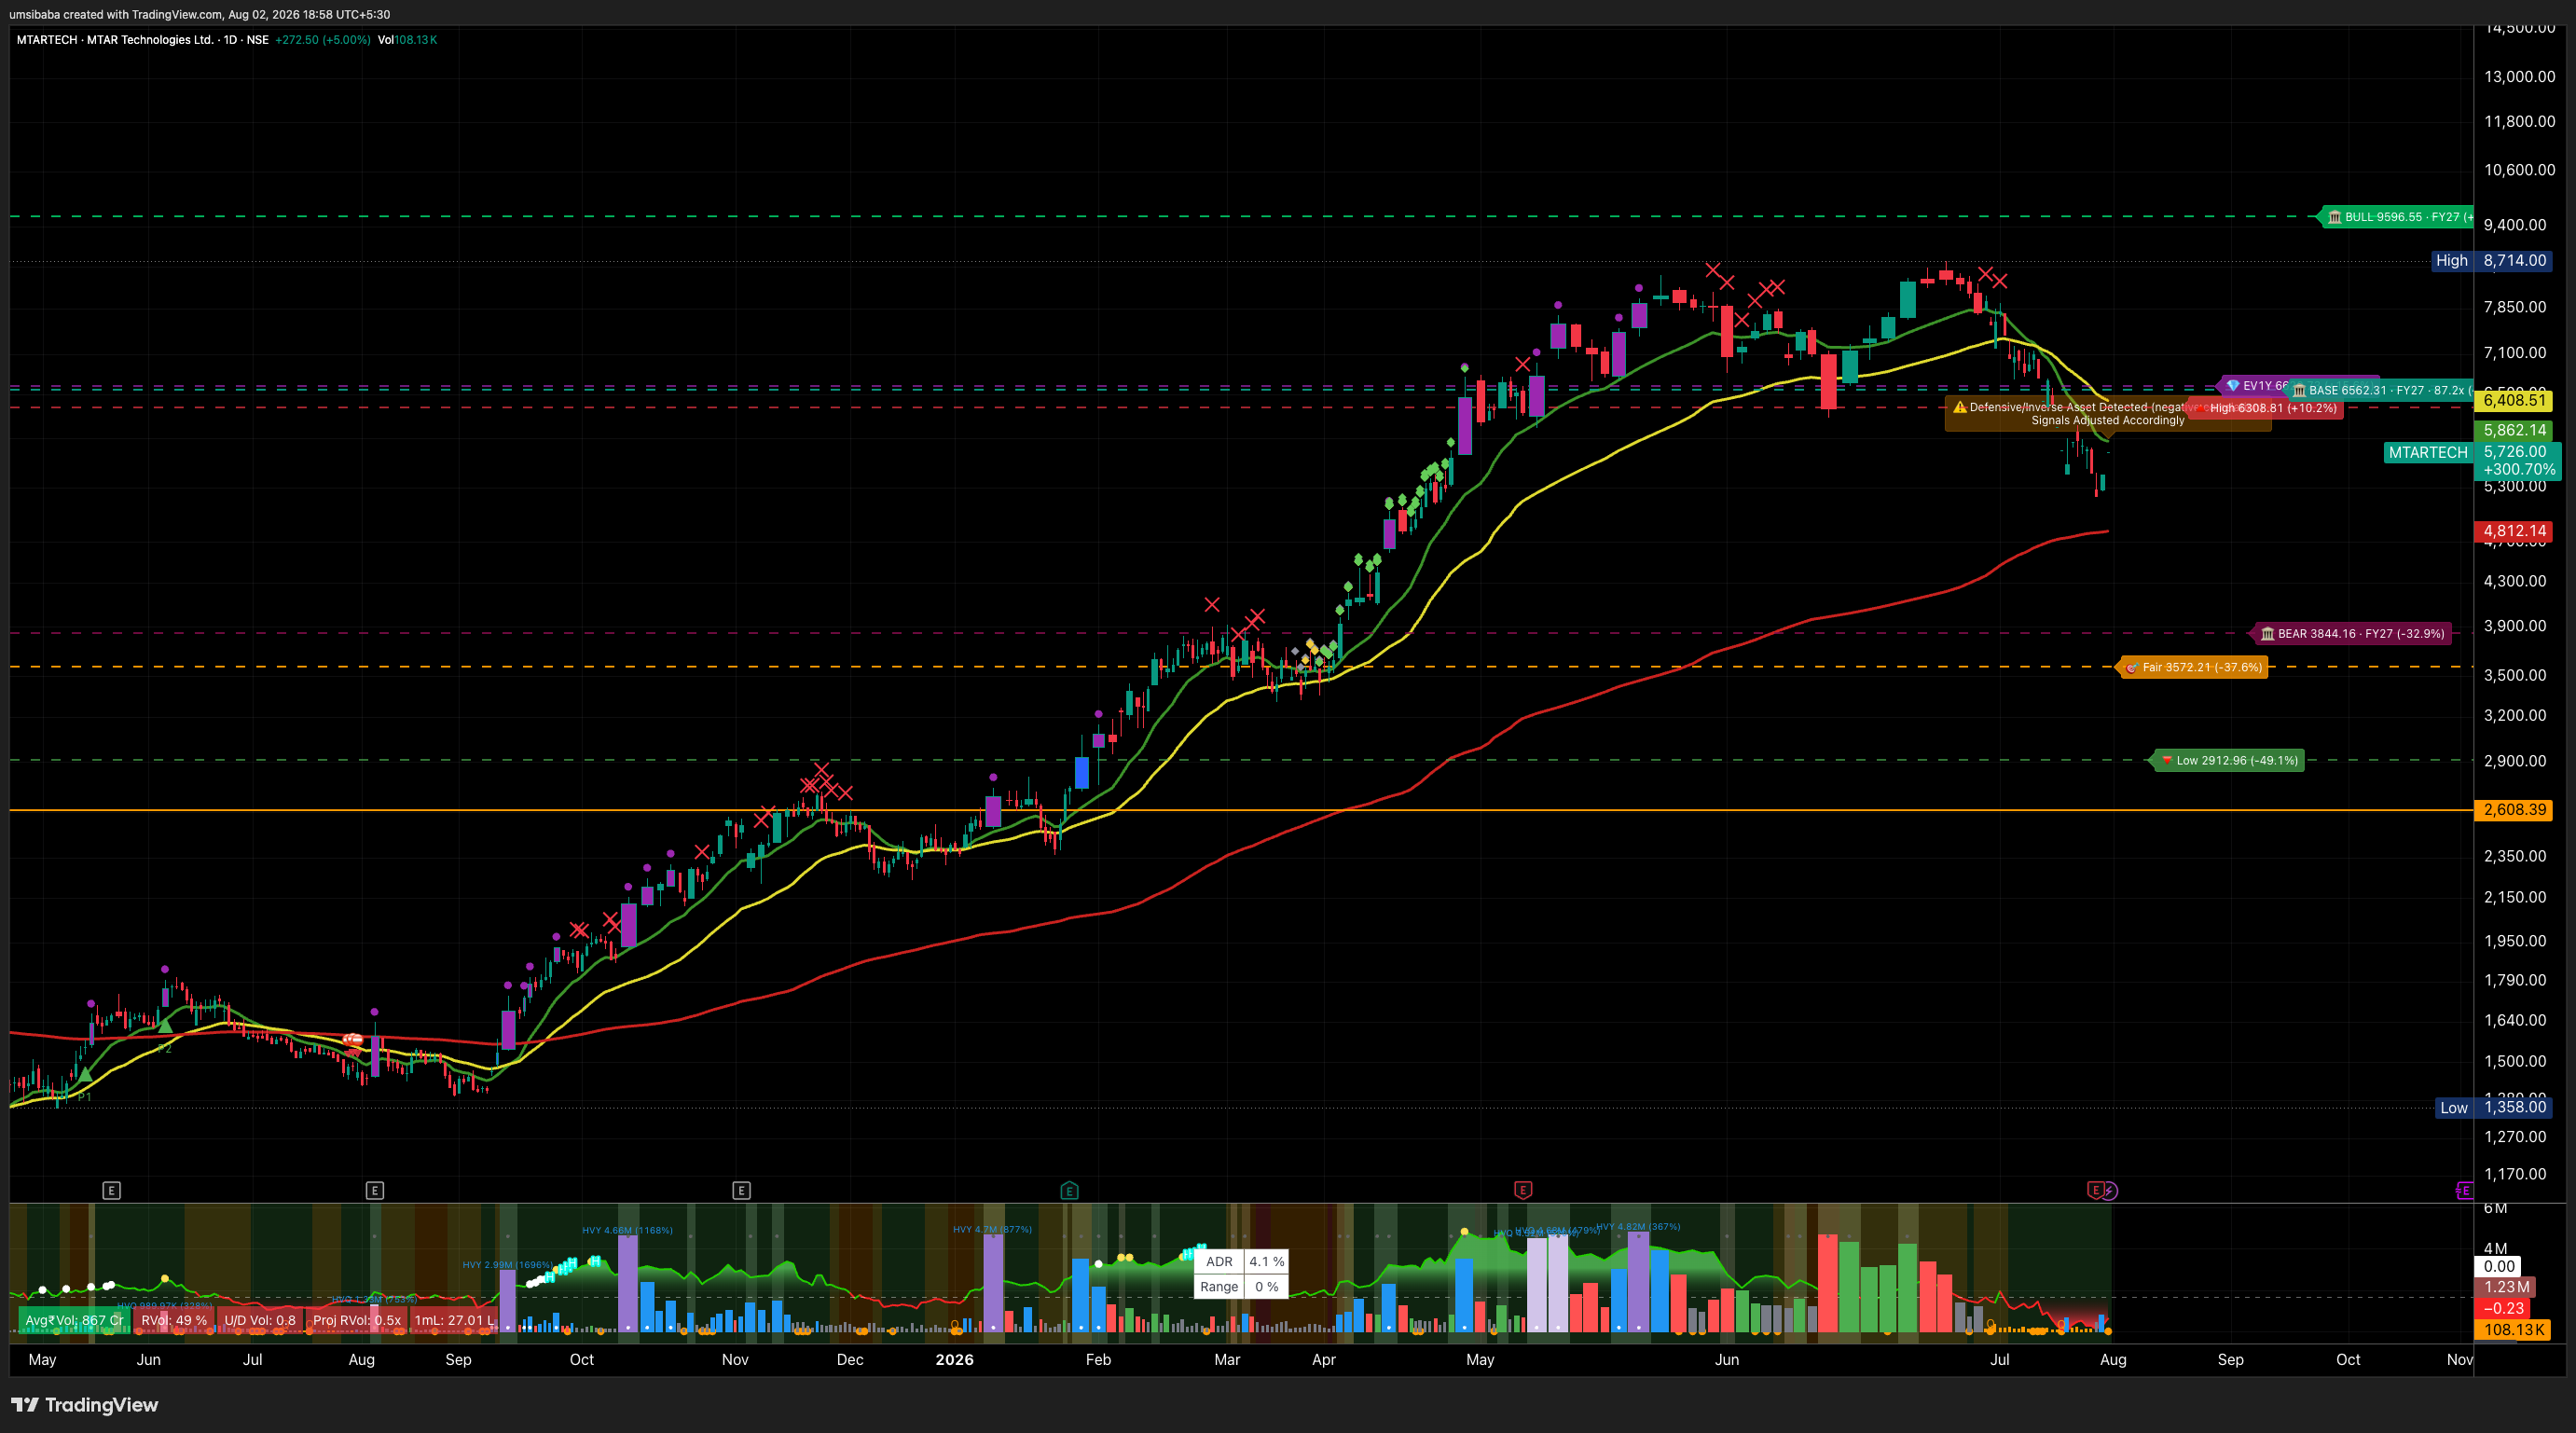
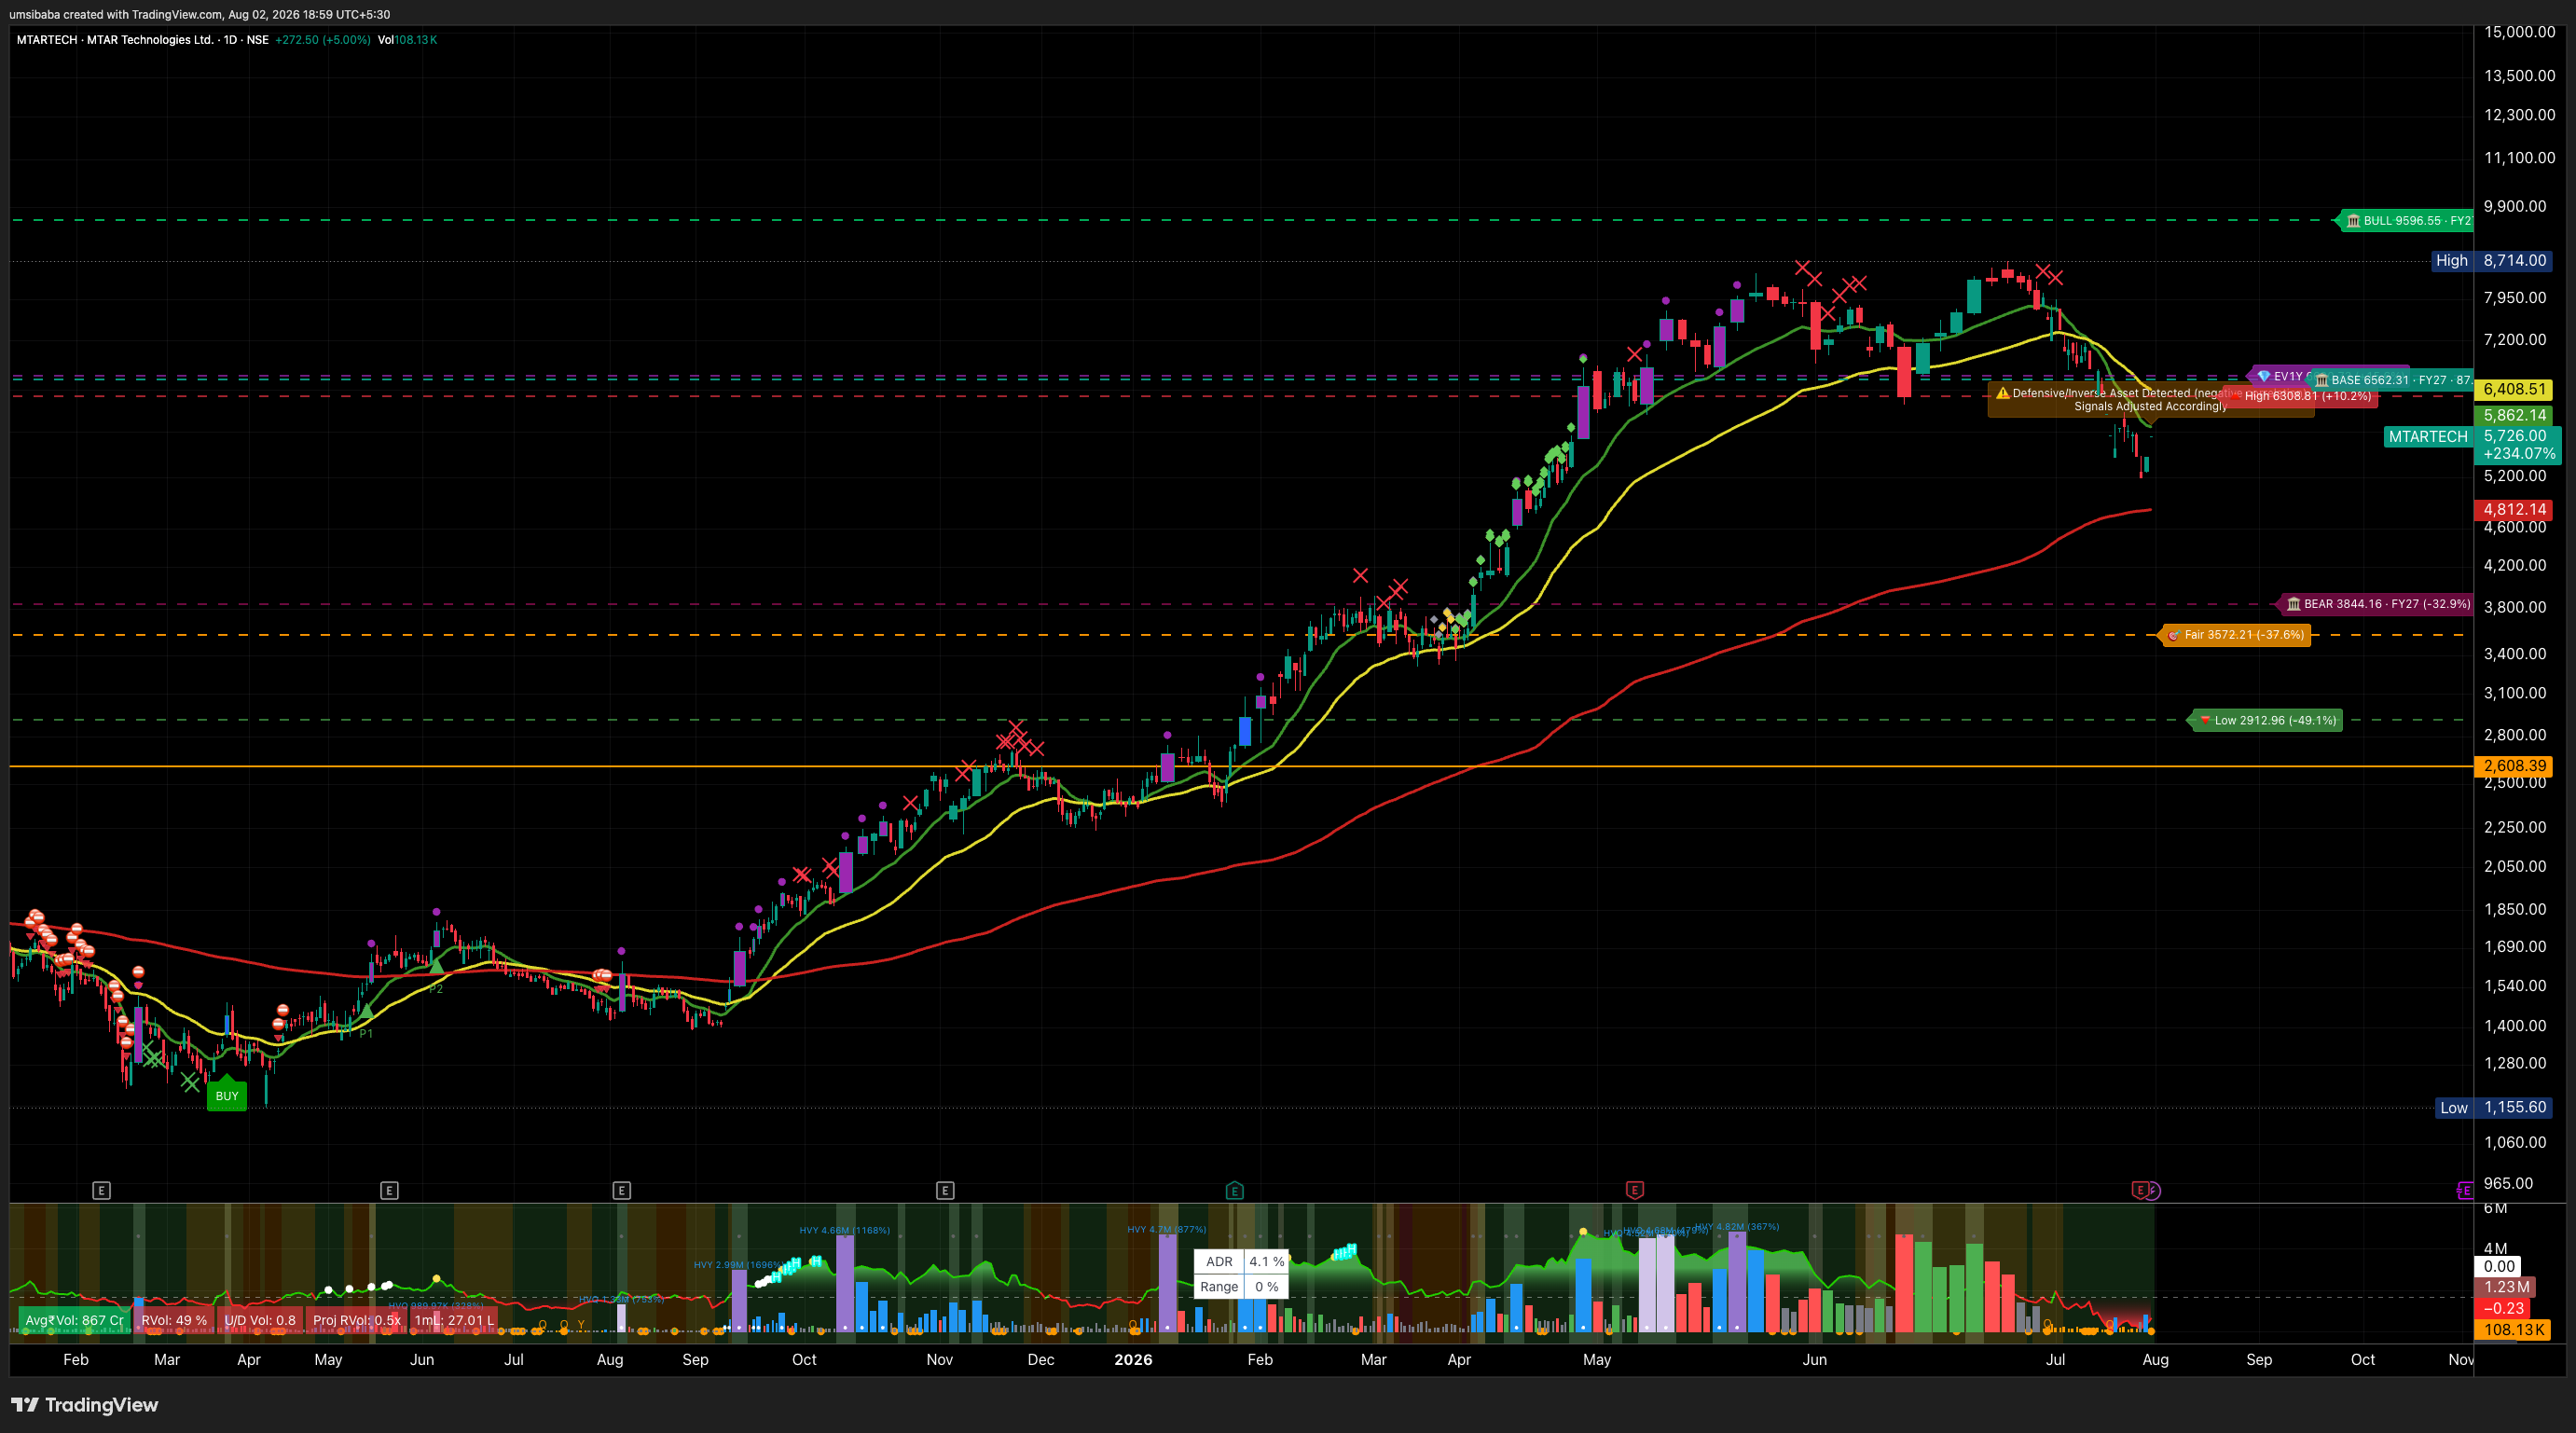
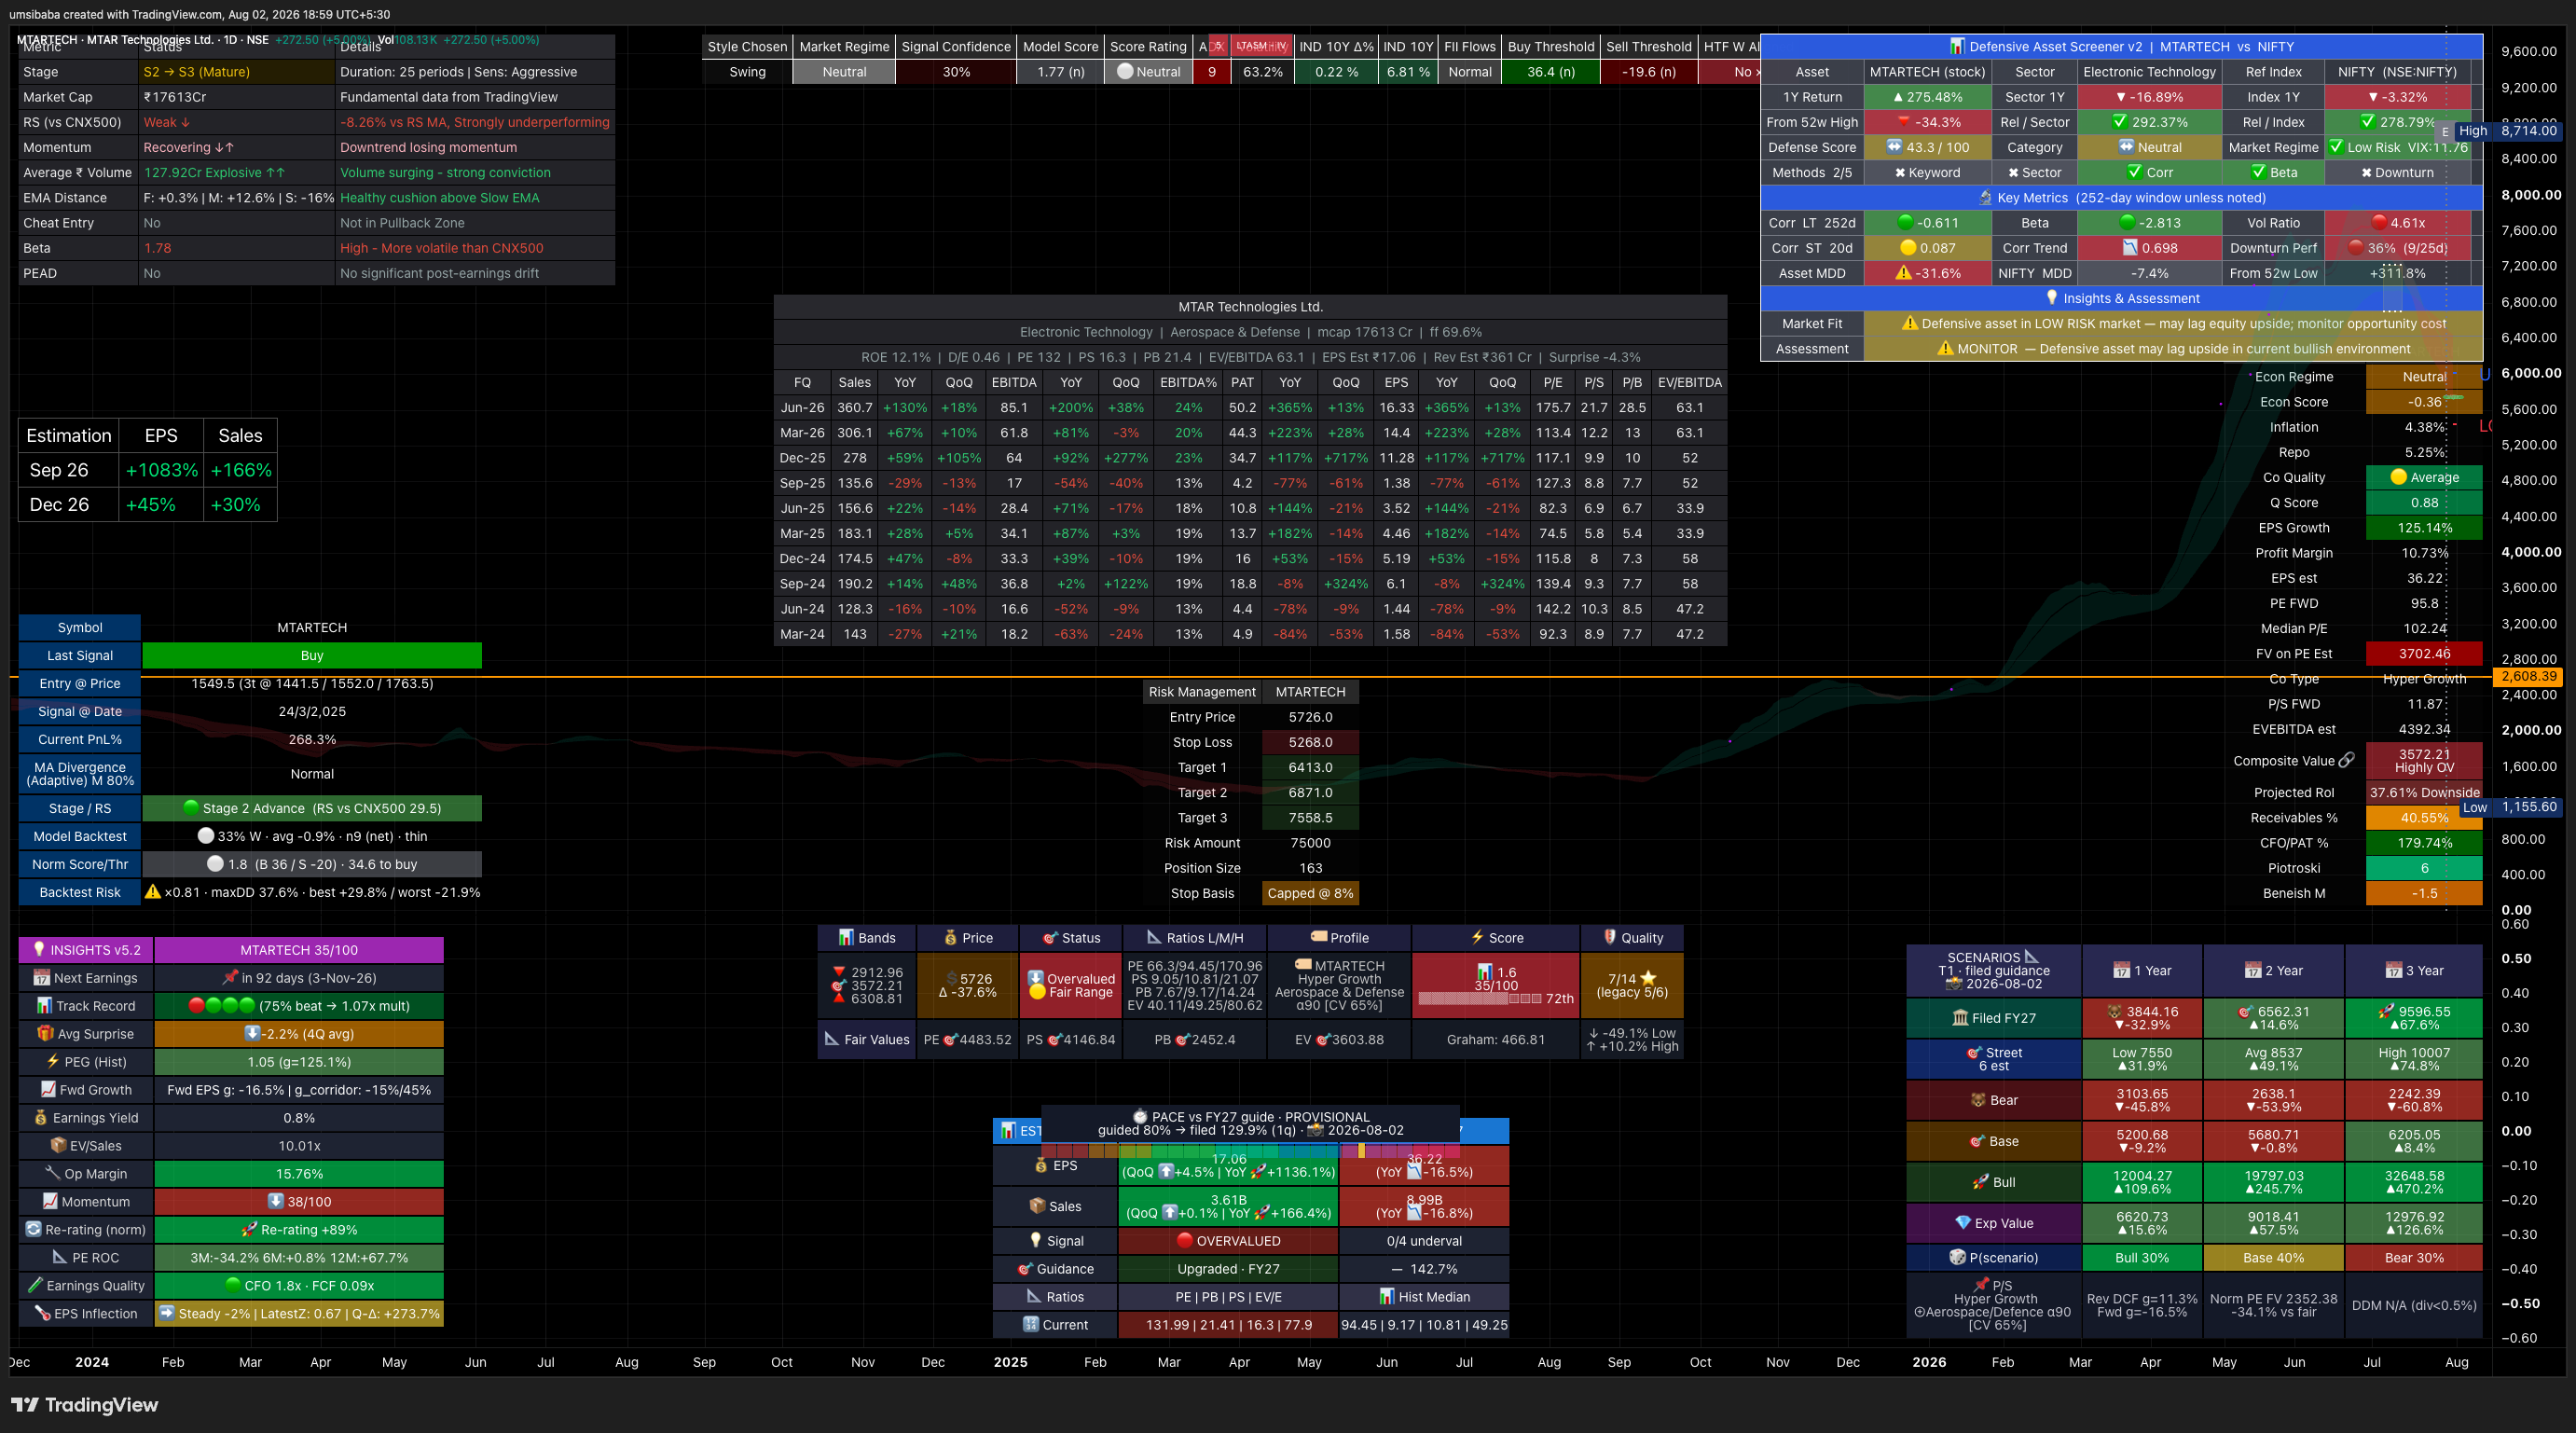
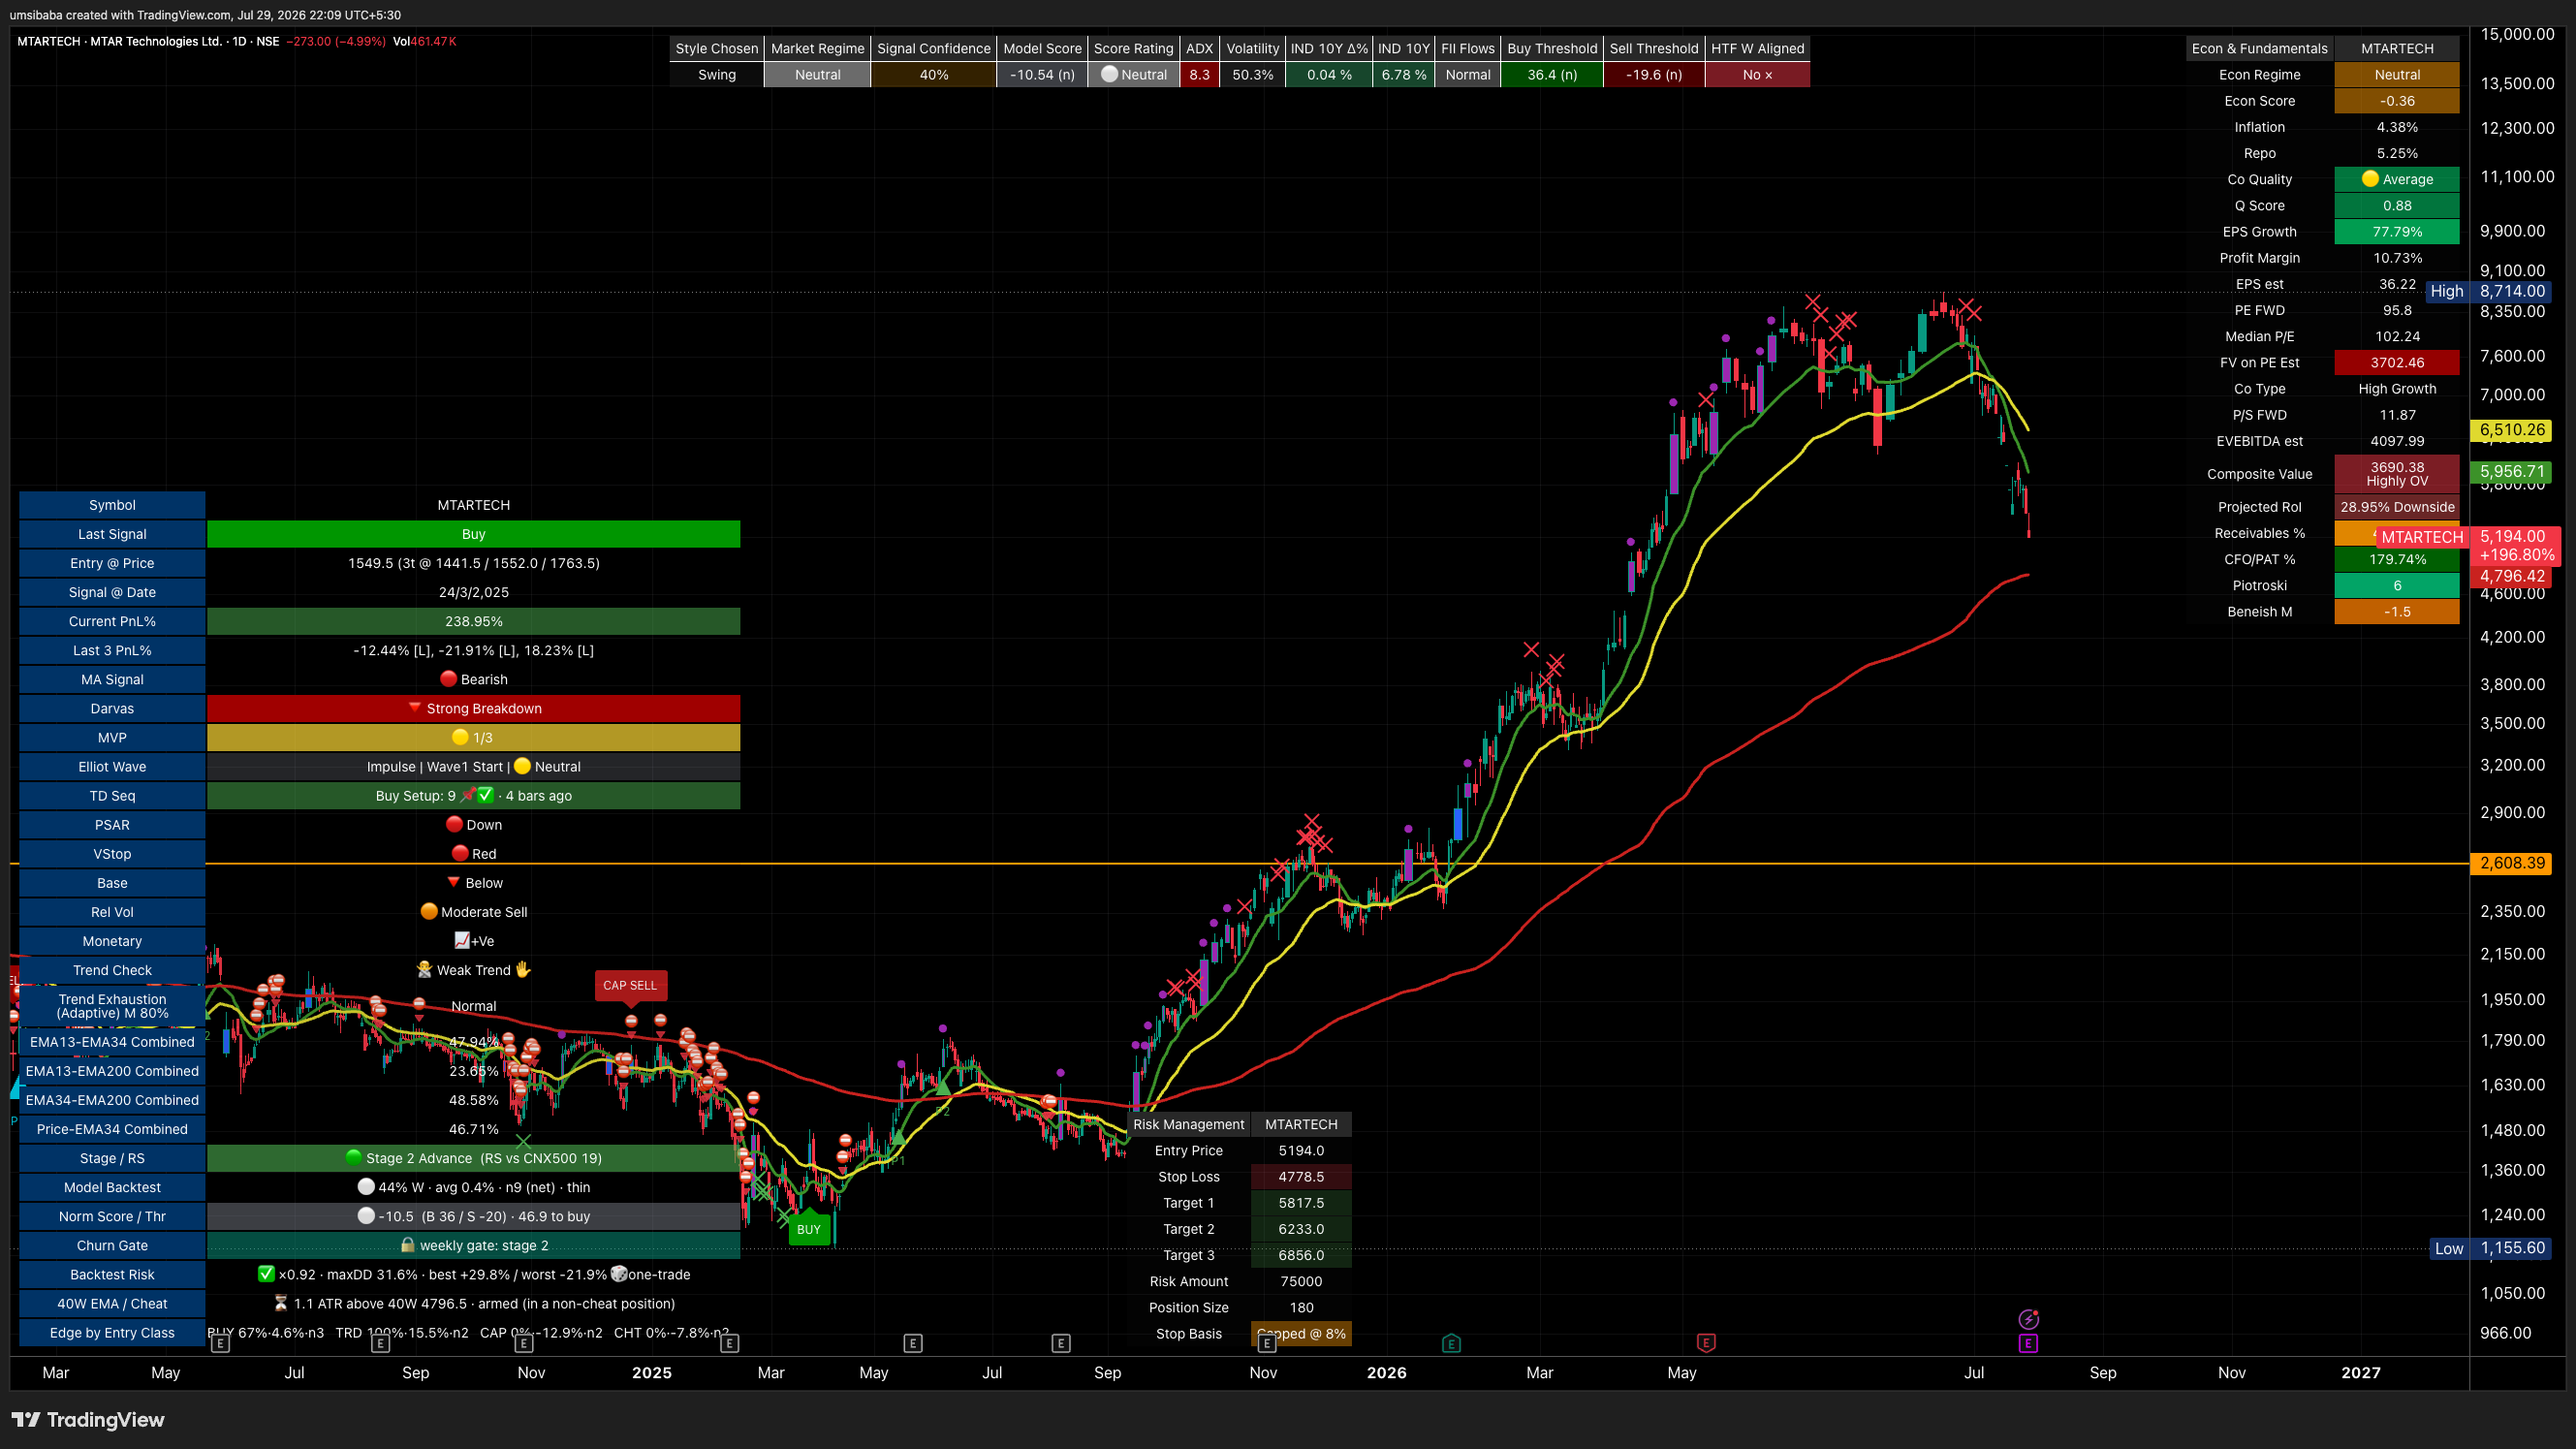
If management delivers what it guided
- FY27 one quarter filed — the pace is shown, not judged: guided +80.0%, filed +129.9% across 1 quarter(s)
- at 185x its FY26 earnings the stock already trades above the top of its own ten-year range (109x)
- this company's own median multiple sits 227% above its filed-industry peers; the scenario uses its own
How these numbers are produced
| Earnings base | FY26 fiscal year EPS ₹31 (screener) |
|---|---|
| Guided growth | 142.7% a year, said on the call of 20-May-2026 · transcript |
| Read across as | operating: revenue growth x margin change — medium confidence |
| Delivery calibration | 0.58x / 1x / 1.36x of what was guided — measured: 76 annual guided-vs-filed pairs + 77 near-complete quarterly years — NSE transcripts against the companies' own filings |
| Exit multiple | 69.89x / 87.25x / 109.17x, this company’s own p20 / median / p80 across 6 filed years |
| Filed-industry peers | median 26.69x across 3 peers — the cross-check, not the input |
| Arithmetic | base EPS × (1 + guided growth × delivery)1 × exit multiple |