MOBAVENUE
Mobavenue
Latest view
Neutral
as of 17 Jun 2026 · not a recommendation
Evidence timeline
What management said
from NSE earnings-call filings · extracted, not interpreted
ebitda margin 20.0%revenue growth 30.0%margin 20.0%generic growth 30.0%
Our long-term operating philosophy continues to be anchored around what we call, and we introduced in the last call as Rule of 50, targeting a sustained annual revenue growth of over 30% along with EBITDA margin prof
Outlook, as stated
While Tejas will cover more about technology architecture, our platform enhancements, and some of the AI roadmap that we have taken for us in FY26 and we move forward in FY27 too, I want to highlight the business translation of those capabilities.
Our long-term operating philosophy continues to be anchored around what we call, and we introduced in the last call as Rule of 50, targeting a sustained annual revenue growth of over 30% along with EBITDA margin profile of 20% and above.
Our long-term operating philosophy is anchored on what we call the 50-plus compounding strategy, which focuses on targeting over 30% sustained revenue growth annually alongside a structured EBITDA margin profile of around 20% and above.
2.98
concrete references per 100 words spoken — counts, currency, units and
named periods, not adjectives
Chart exhibits
as drawn · not updated since
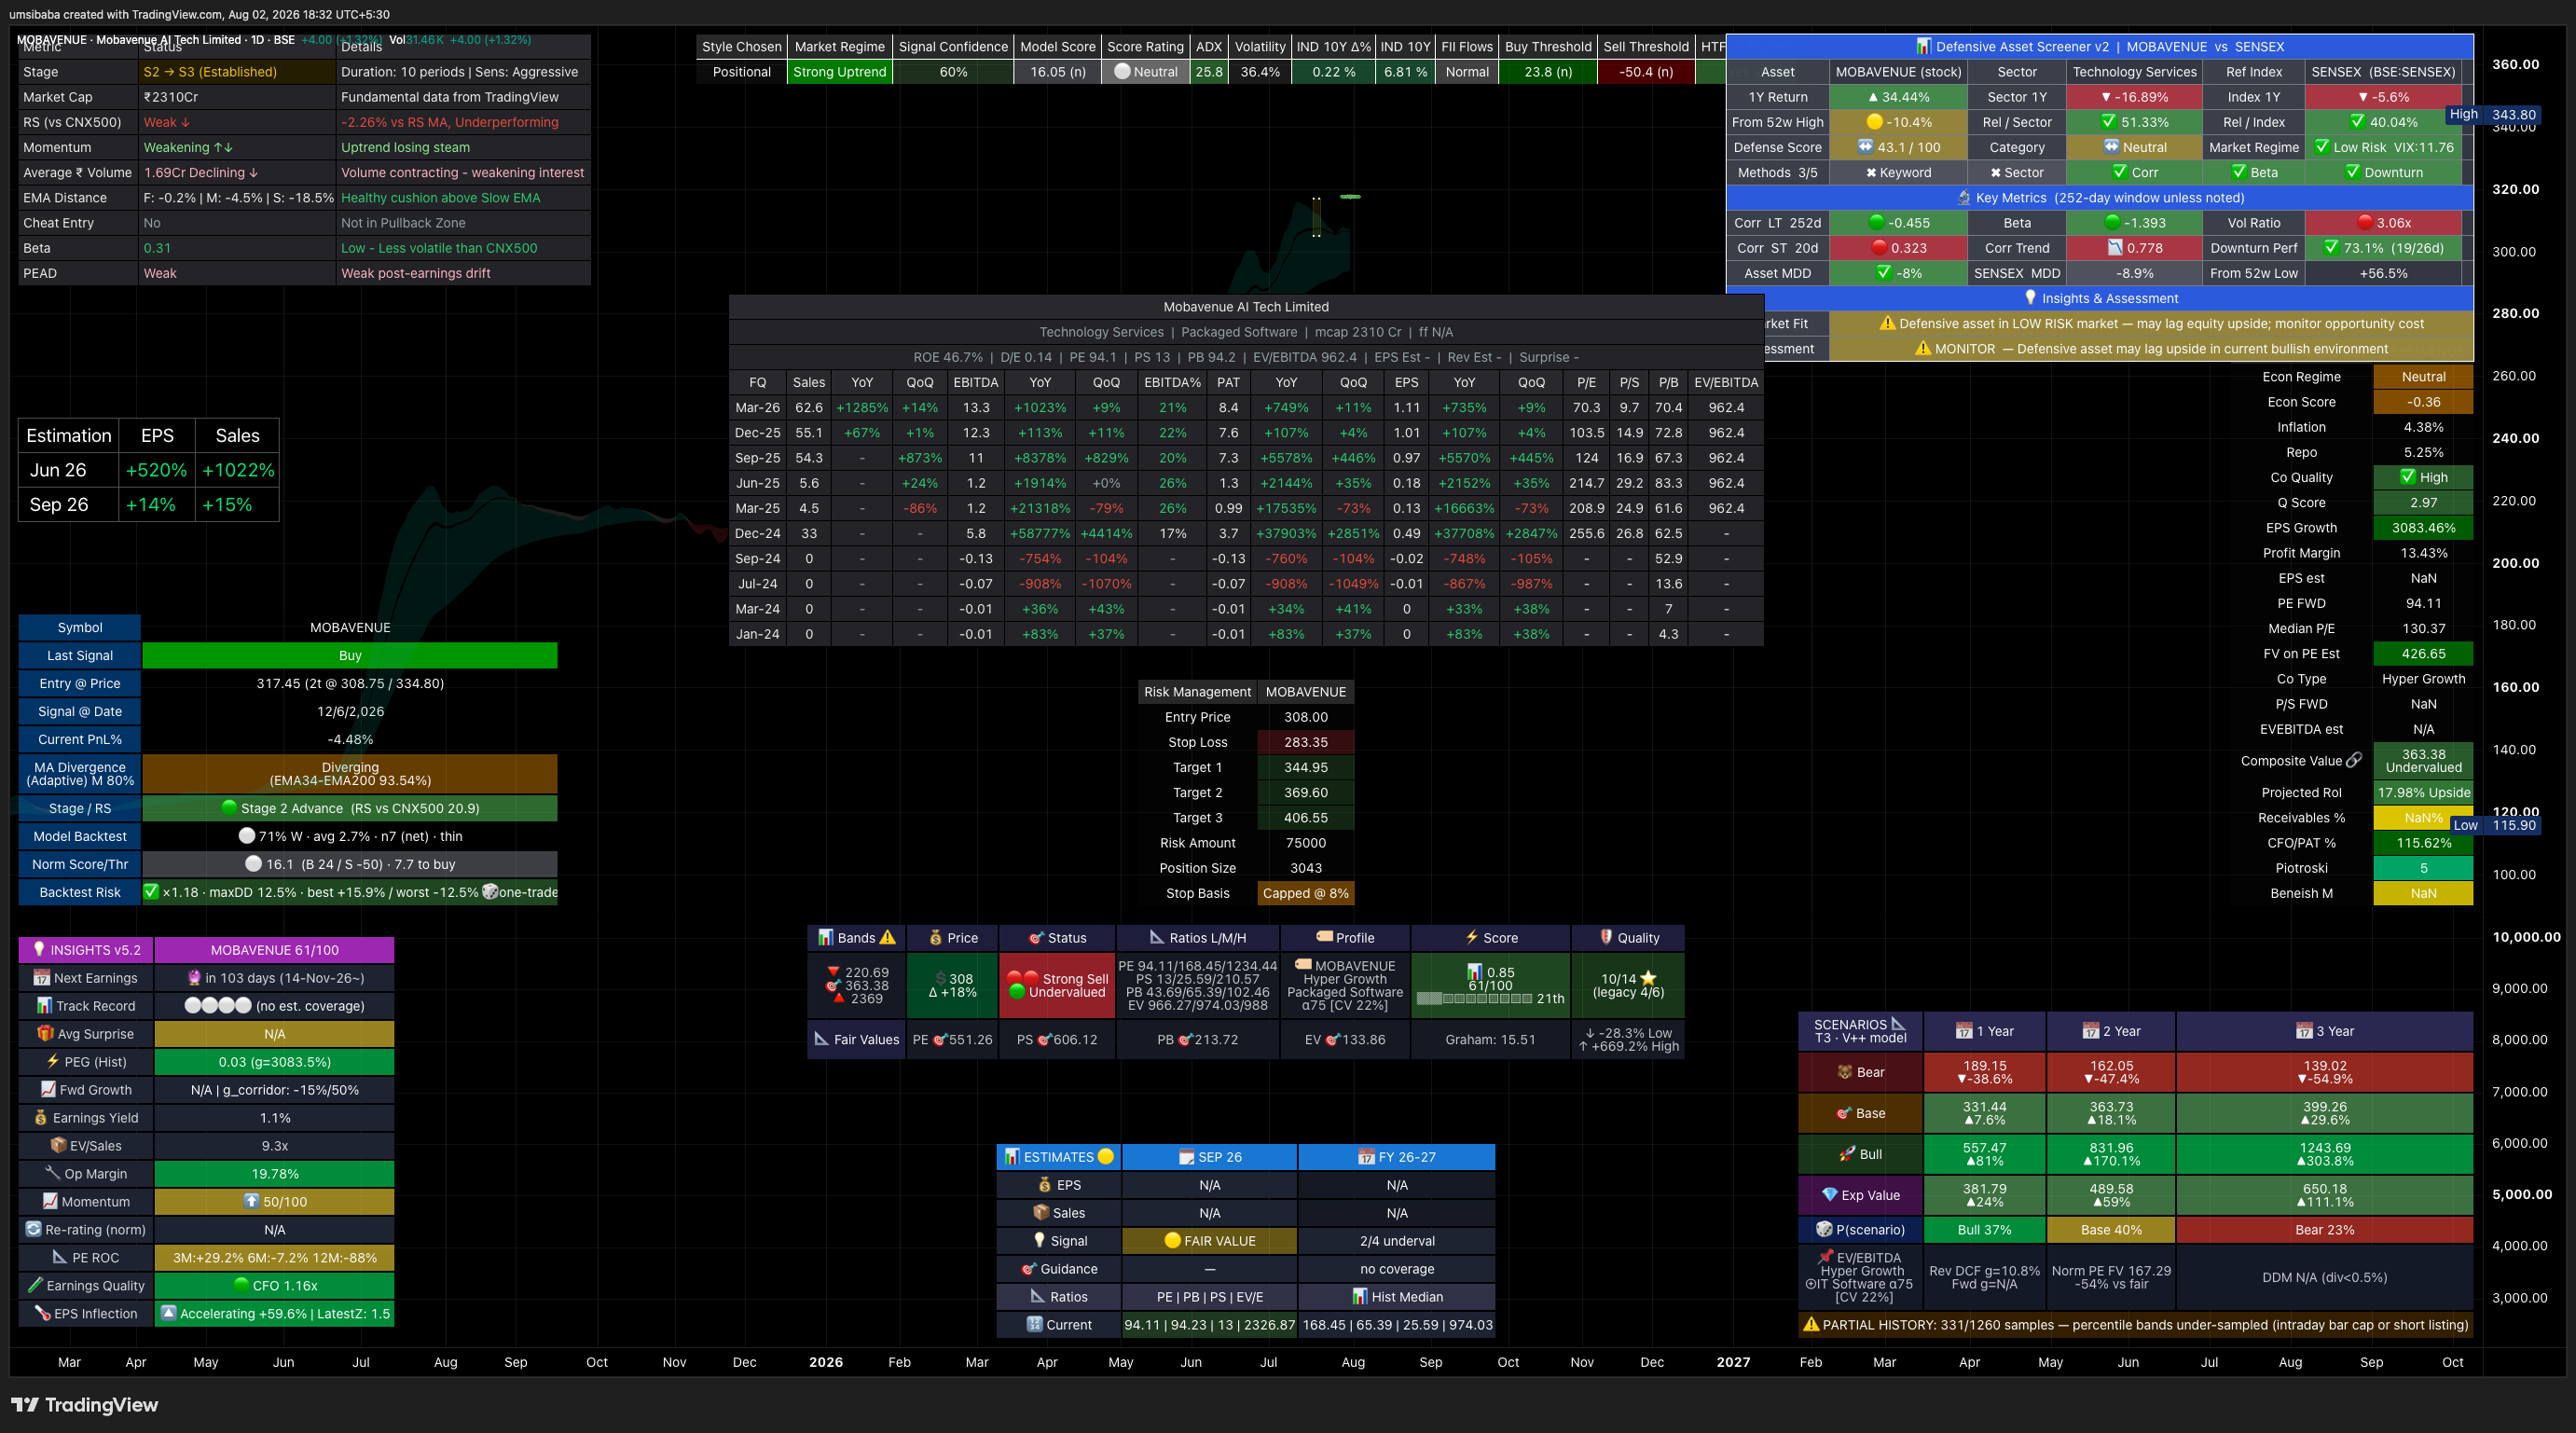
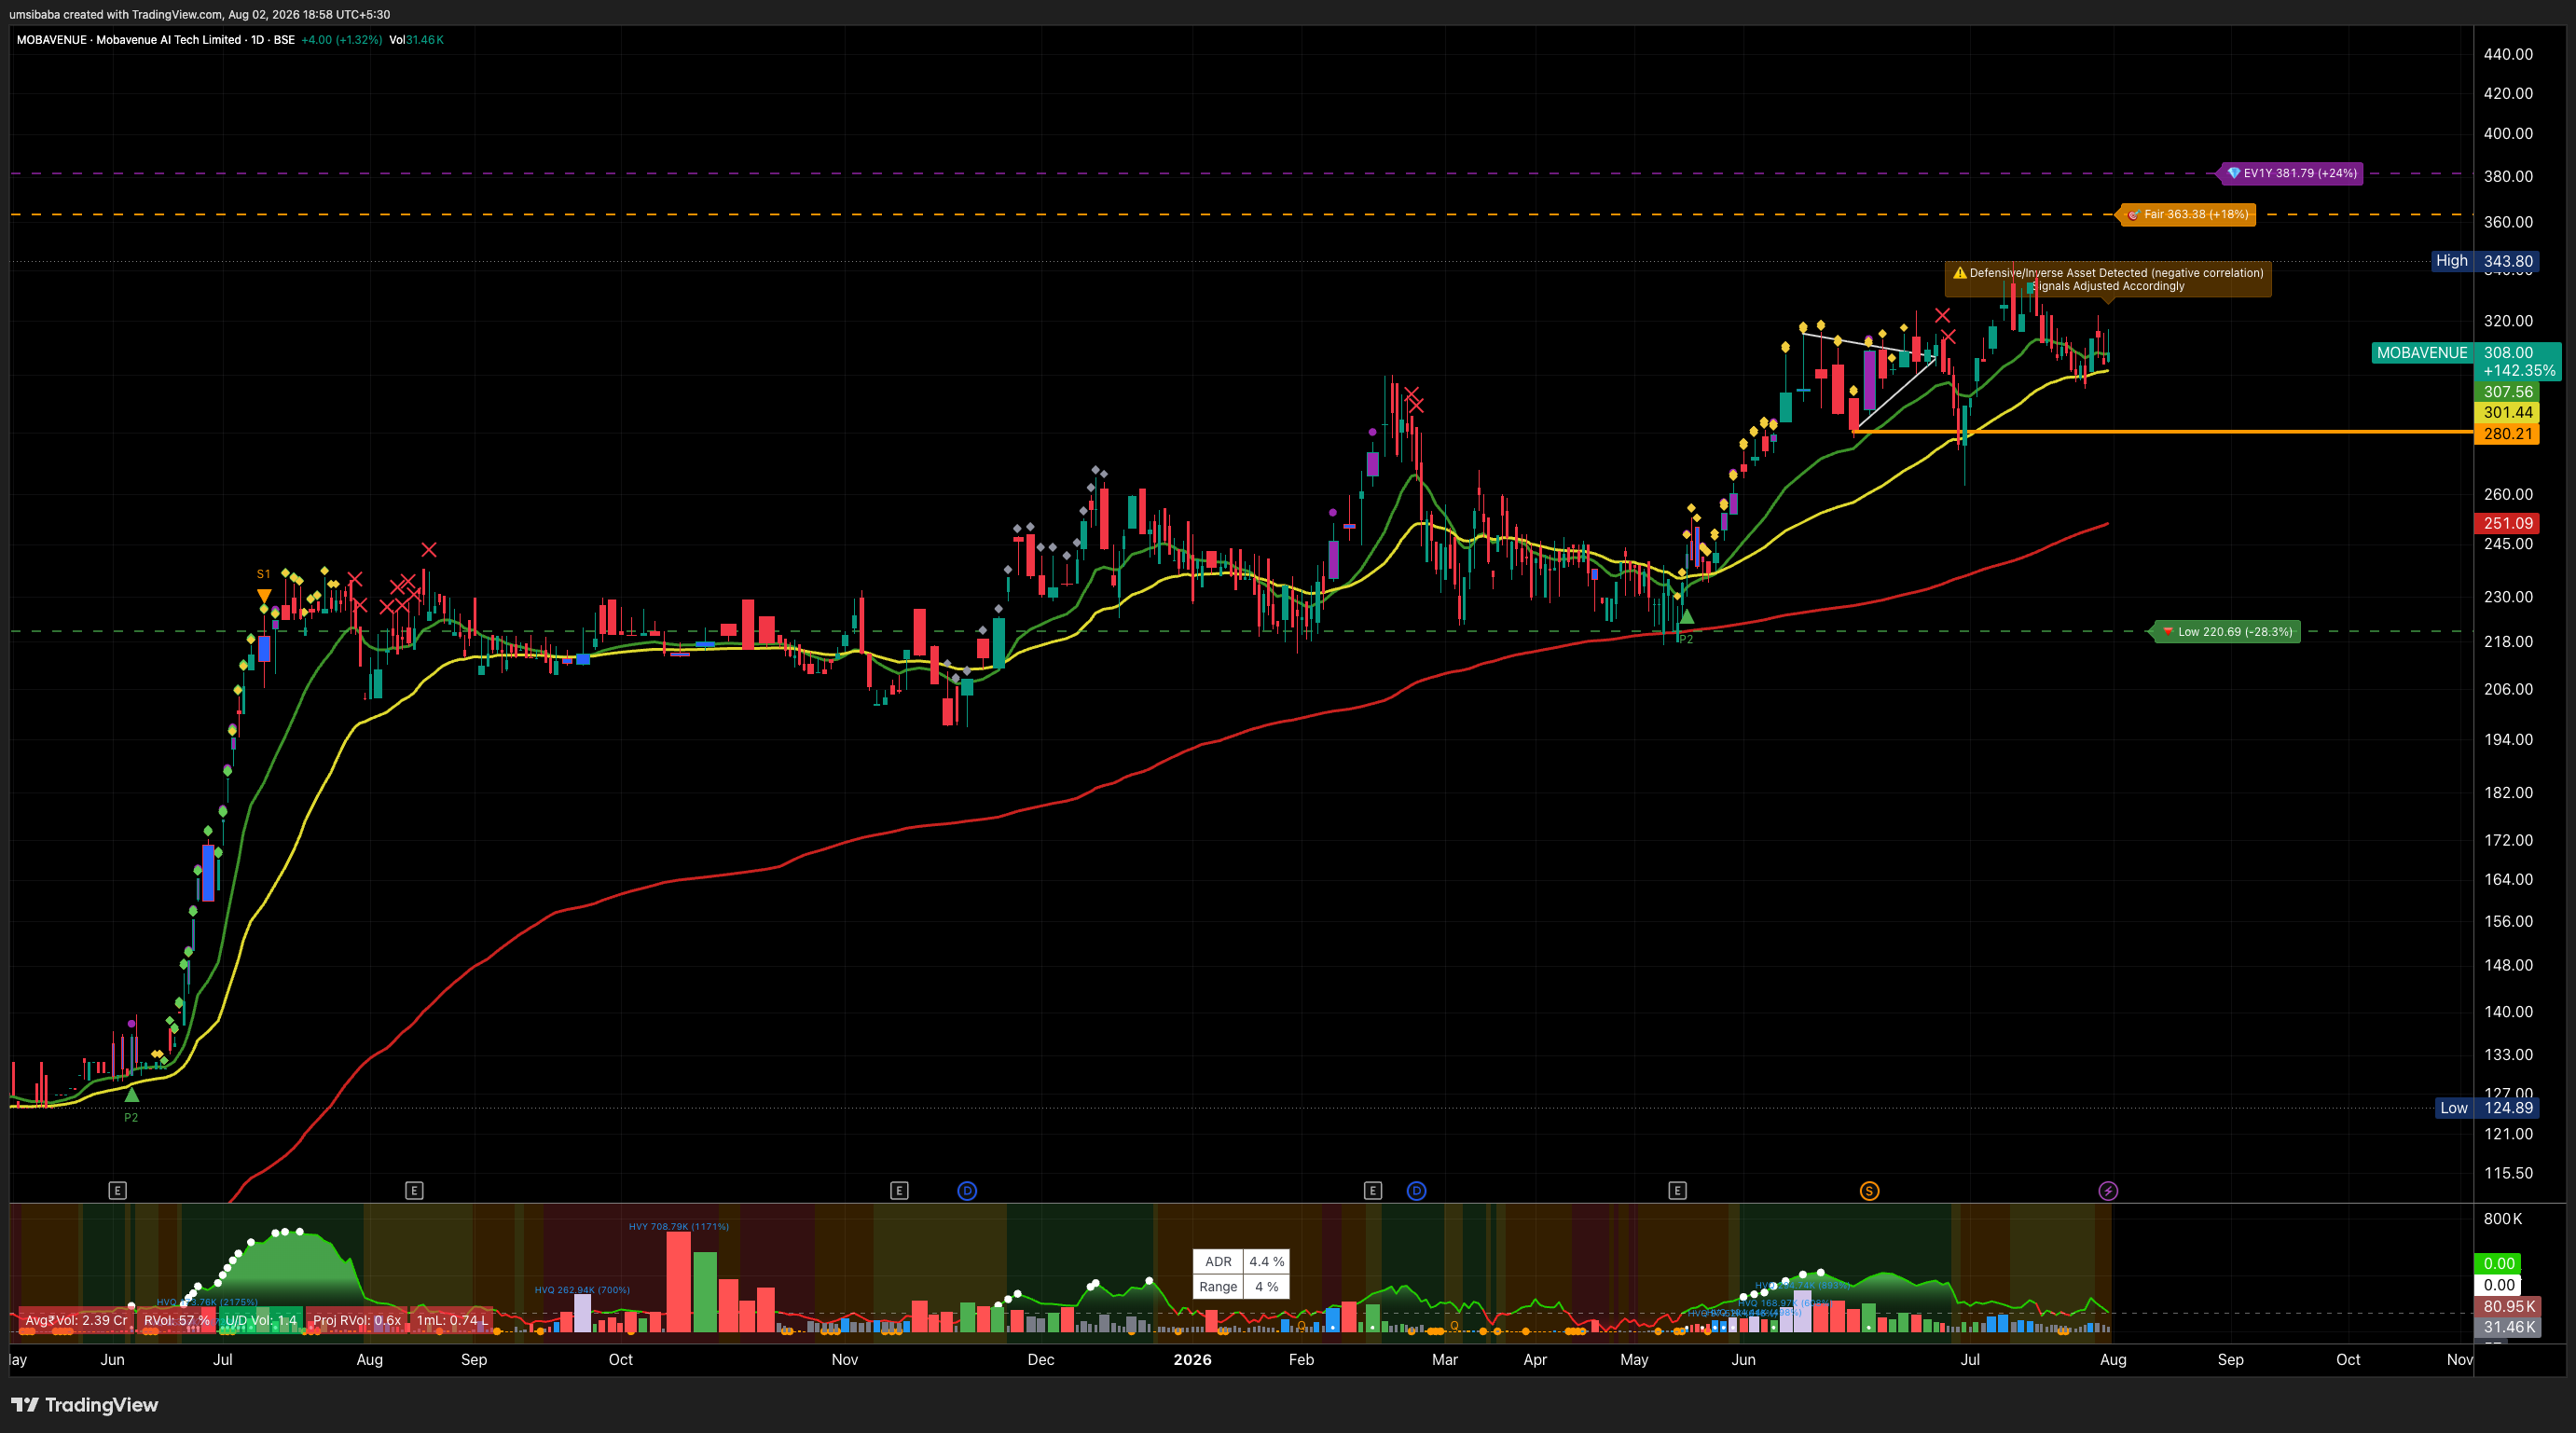
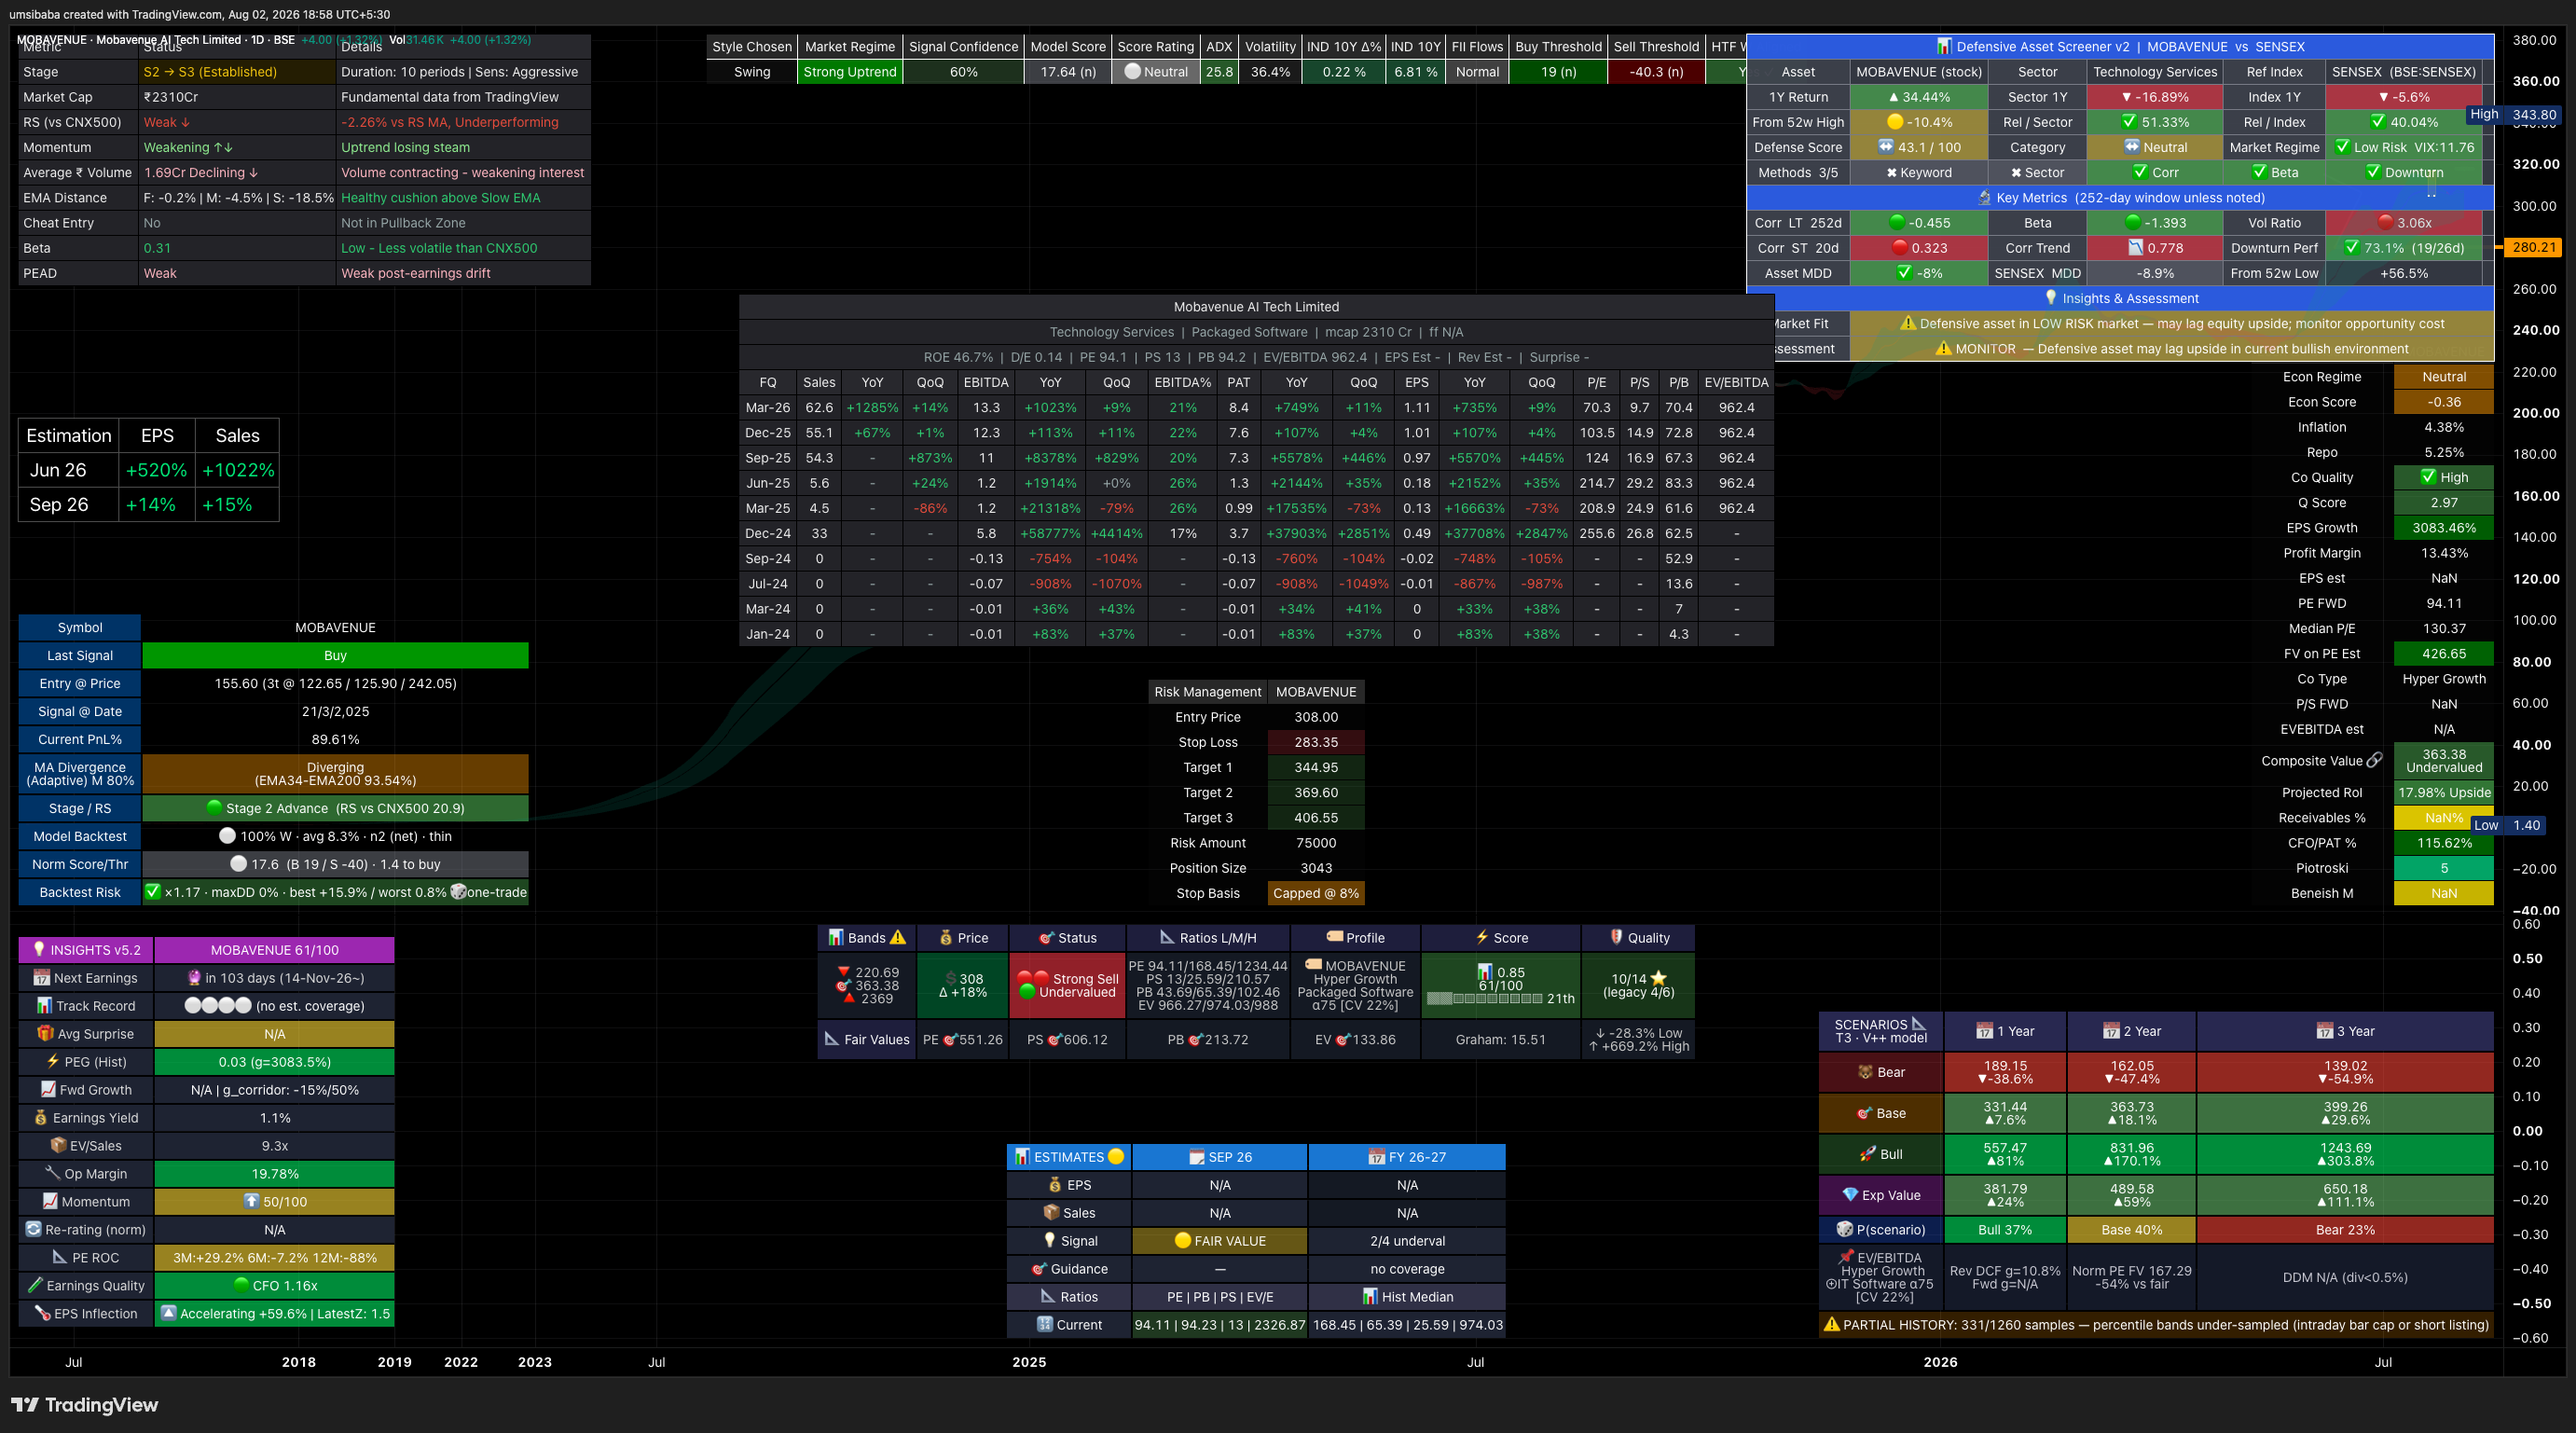
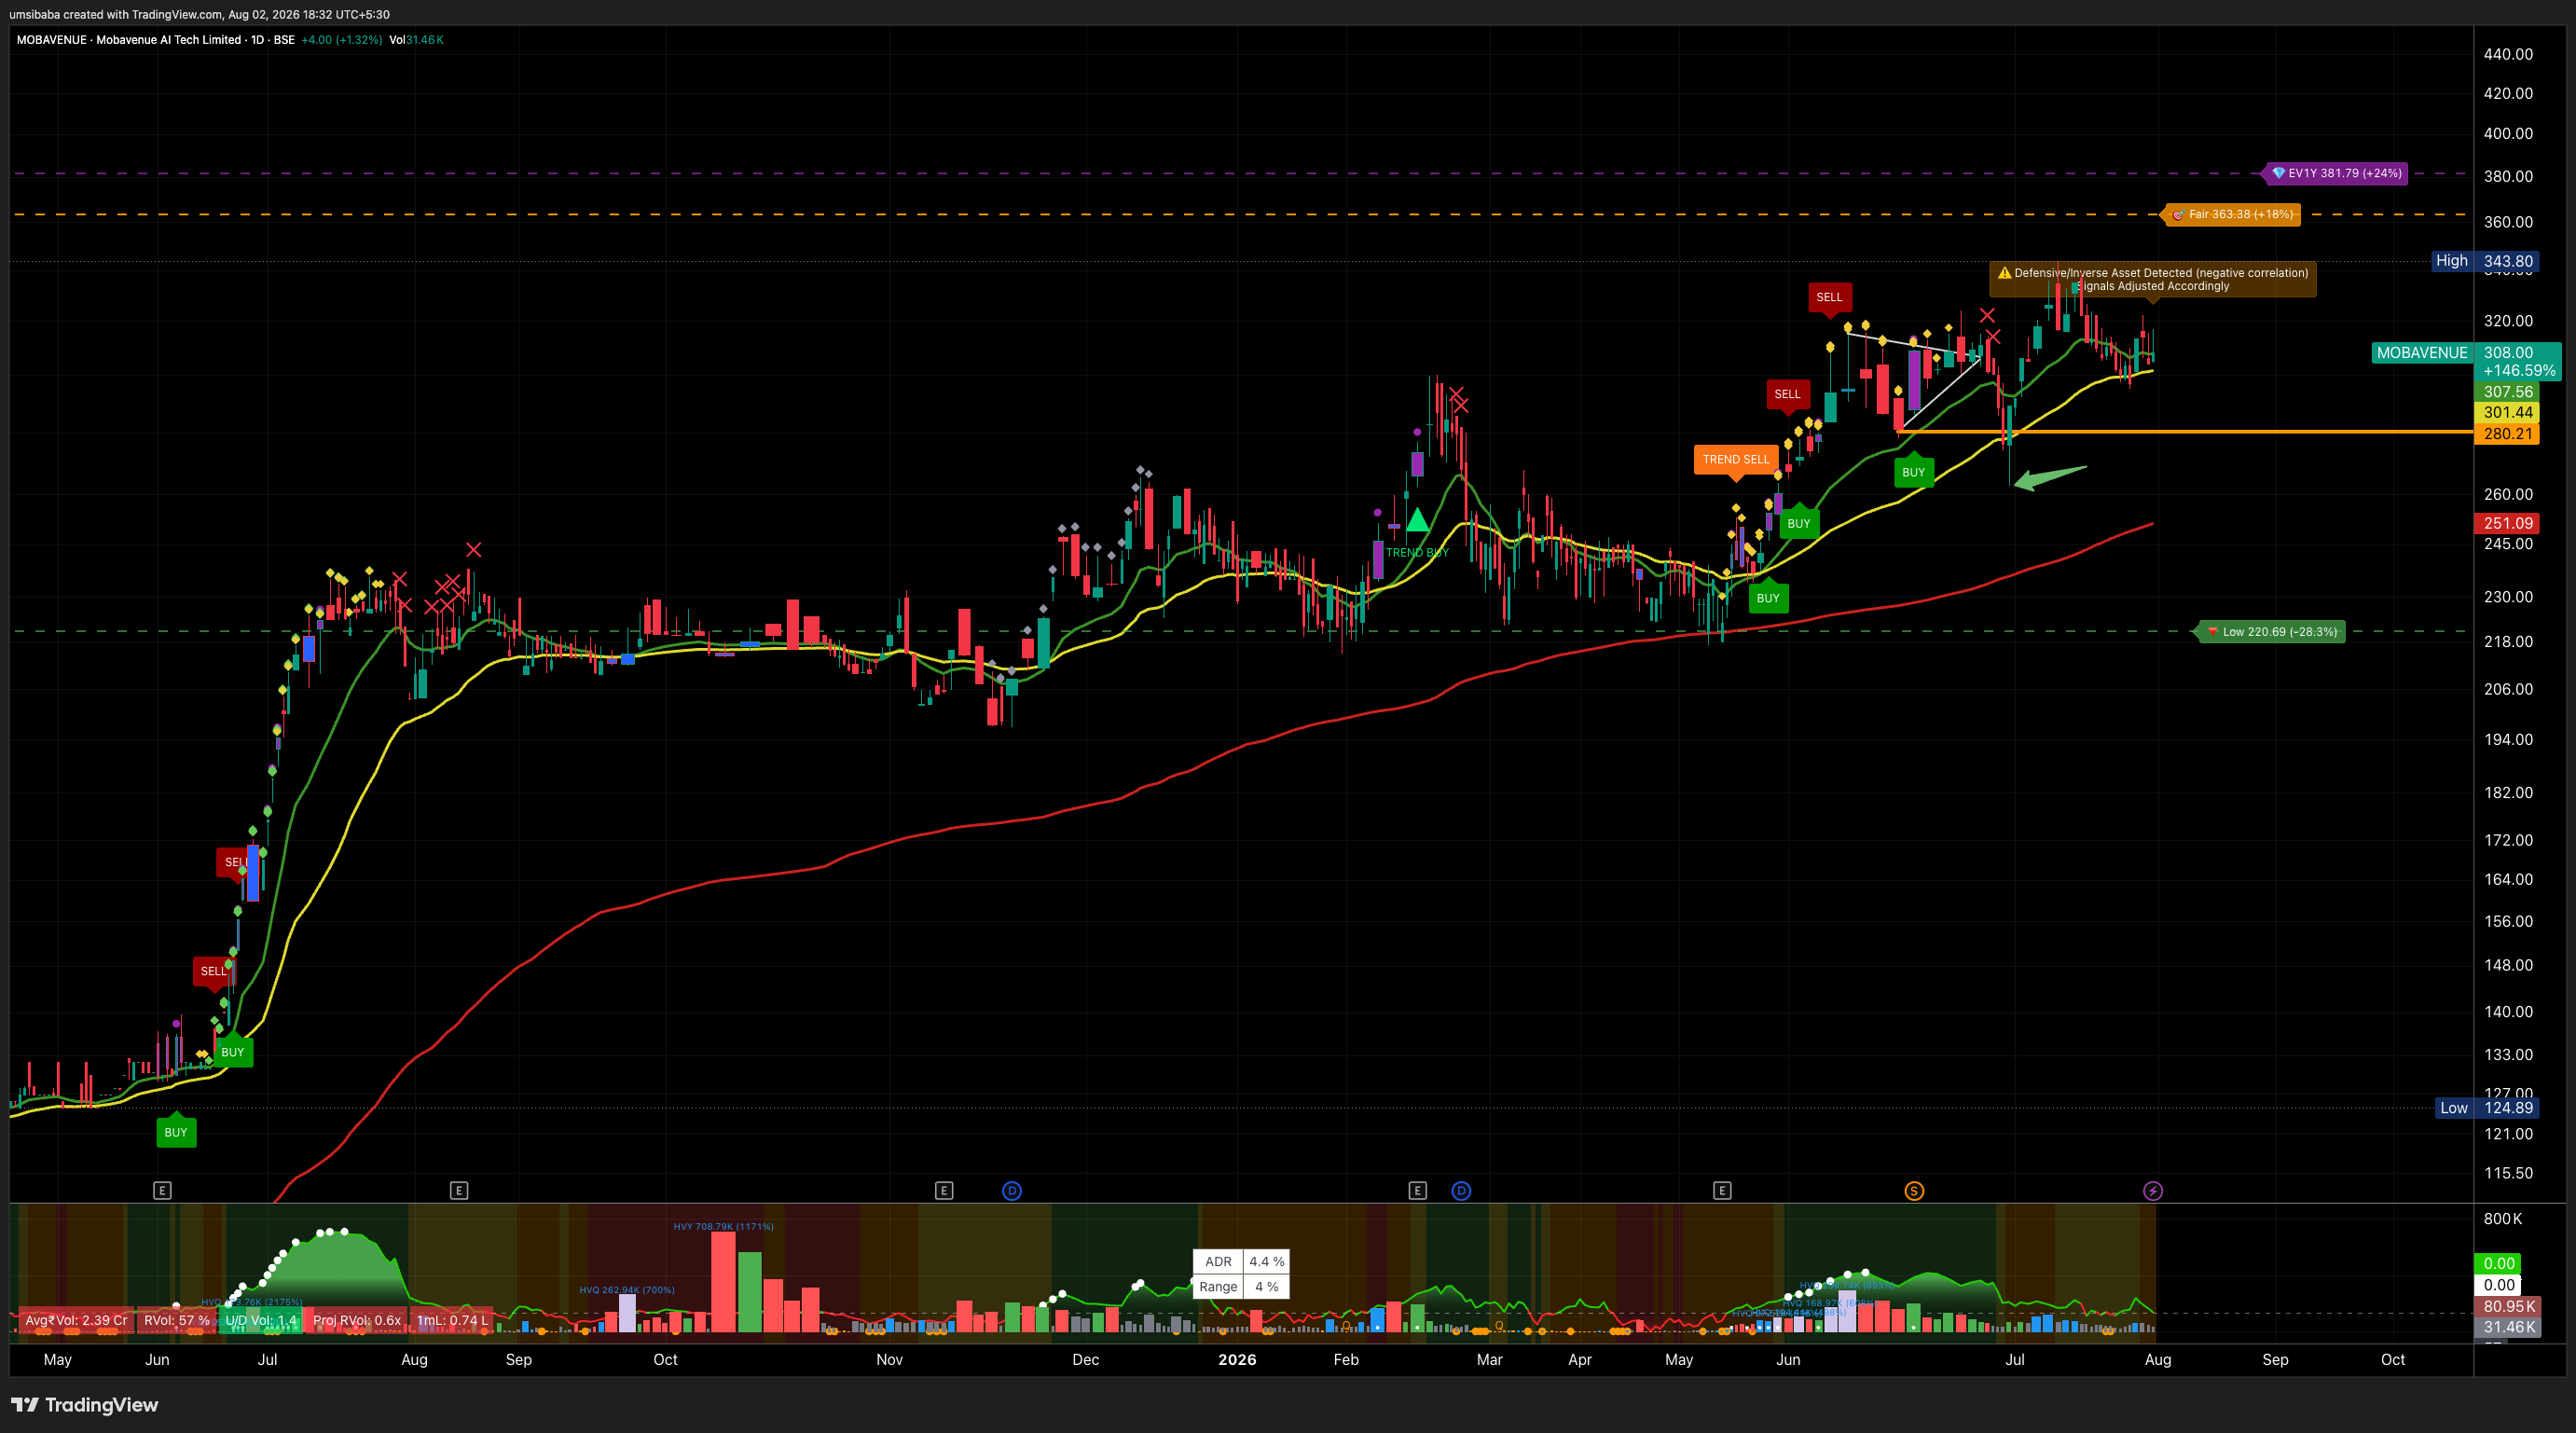
If management delivers what it guided
arithmetic on filed guidance and past valuations · not a price target
MOBAVENUE
FY26 → FY27 · 1 year of guidance · ~0.7 years from today₹308 today
BEAR
₹78
-75%
17.3% a year · 20.4x exit
BASE
₹128
-58%
30% a year · 30.2x exit
BULL
₹245
-20%
40.8% a year · 53.3x exit
Where the market has priced it
2x94x today326x
- this company has too little filed history for a multiple band of its own, so the exit multiple is the median of 21 Packaged Software peers
- at 94x its FY26 earnings the stock already trades above the top of its own ten-year range (53x)
- the range is unusually wide — read it as the span of management's own claim, not as a forecast
How these numbers are produced
| Earnings base | FY26 TTM EPS ₹3.27 (universe (TradingView, diluted TTM)) |
|---|---|
| Guided growth | 30% a year, said on the call of 01-May-2026 · transcript |
| Read across as | operating: revenue growth, margin held flat — medium confidence |
| Delivery calibration | 0.58x / 1x / 1.36x of what was guided — measured: 76 annual guided-vs-filed pairs + 77 near-complete quarterly years — NSE transcripts against the companies' own filings |
| Exit multiple | 20.35x / 30.2x / 53.33x, this company’s own p20 / median / p80 across 21 filed years |
| Filed-industry peers | median 30.2x across 21 peers — the cross-check, not the input |
| Arithmetic | base EPS × (1 + guided growth × delivery)1 × exit multiple |
Arithmetic on management’s own guidance and this company’s own past valuations. Not a price target, not a recommendation, and not a forecast of what the stock will do.
Price chart
260 sessions to 31 Jul 2026 ·
daily close ·
our own broker data