LUMAXTECH
Lumax Auto Technologies (LUMAXTECH)
Latest view
—
as of 4 Mar 2026 · not a recommendation
Evidence timeline
4 Mar
2026
2026
Lumax Auto Technologies (LUMAXTECH) — Investment Thesis | PrimAegis Research
—/r/thesis/LUMAXTECH_2026-03-04.html
4 Mar
2026
2026
LUMAXTECH — Thesis
—/r/thesis/LUMAXTECH_2026-03-04.pdf
What management said
from NSE earnings-call filings · extracted, not interpreted
margin 14.5%
The Company also crossed the INR 700 crore mark for EBITDA to reach record EBITDA of INR 705 crore with a healthy margin of 14.5% along with a record PAT of INR 337 crore.
Call 05-Jun-2026 · transcript PDF
Outlook, as stated
In closing, while we remain watchful of the macroeconomic uncertainties, commodity inflation and the energy price volatility, the overall demand environment and industry outlook continues to be favourable, giving us confidence as we enter FY 27.
There is a slight increase in depreciation cost in Q4 of FY 26, part of it is due to capitalization, but majorly on account of reclassification in the life of intangible assets, which was acquired as a part of Greenfuel energy business.
The Greenfuel energy business acquired in November of last financial year contributed INR 383 crore in FY 26, backed by an order book of INR 180 crore with margins expected to be accretive to the Group average over the medium term.
6.9
concrete references per 100 words spoken — counts, currency, units and
named periods, not adjectives
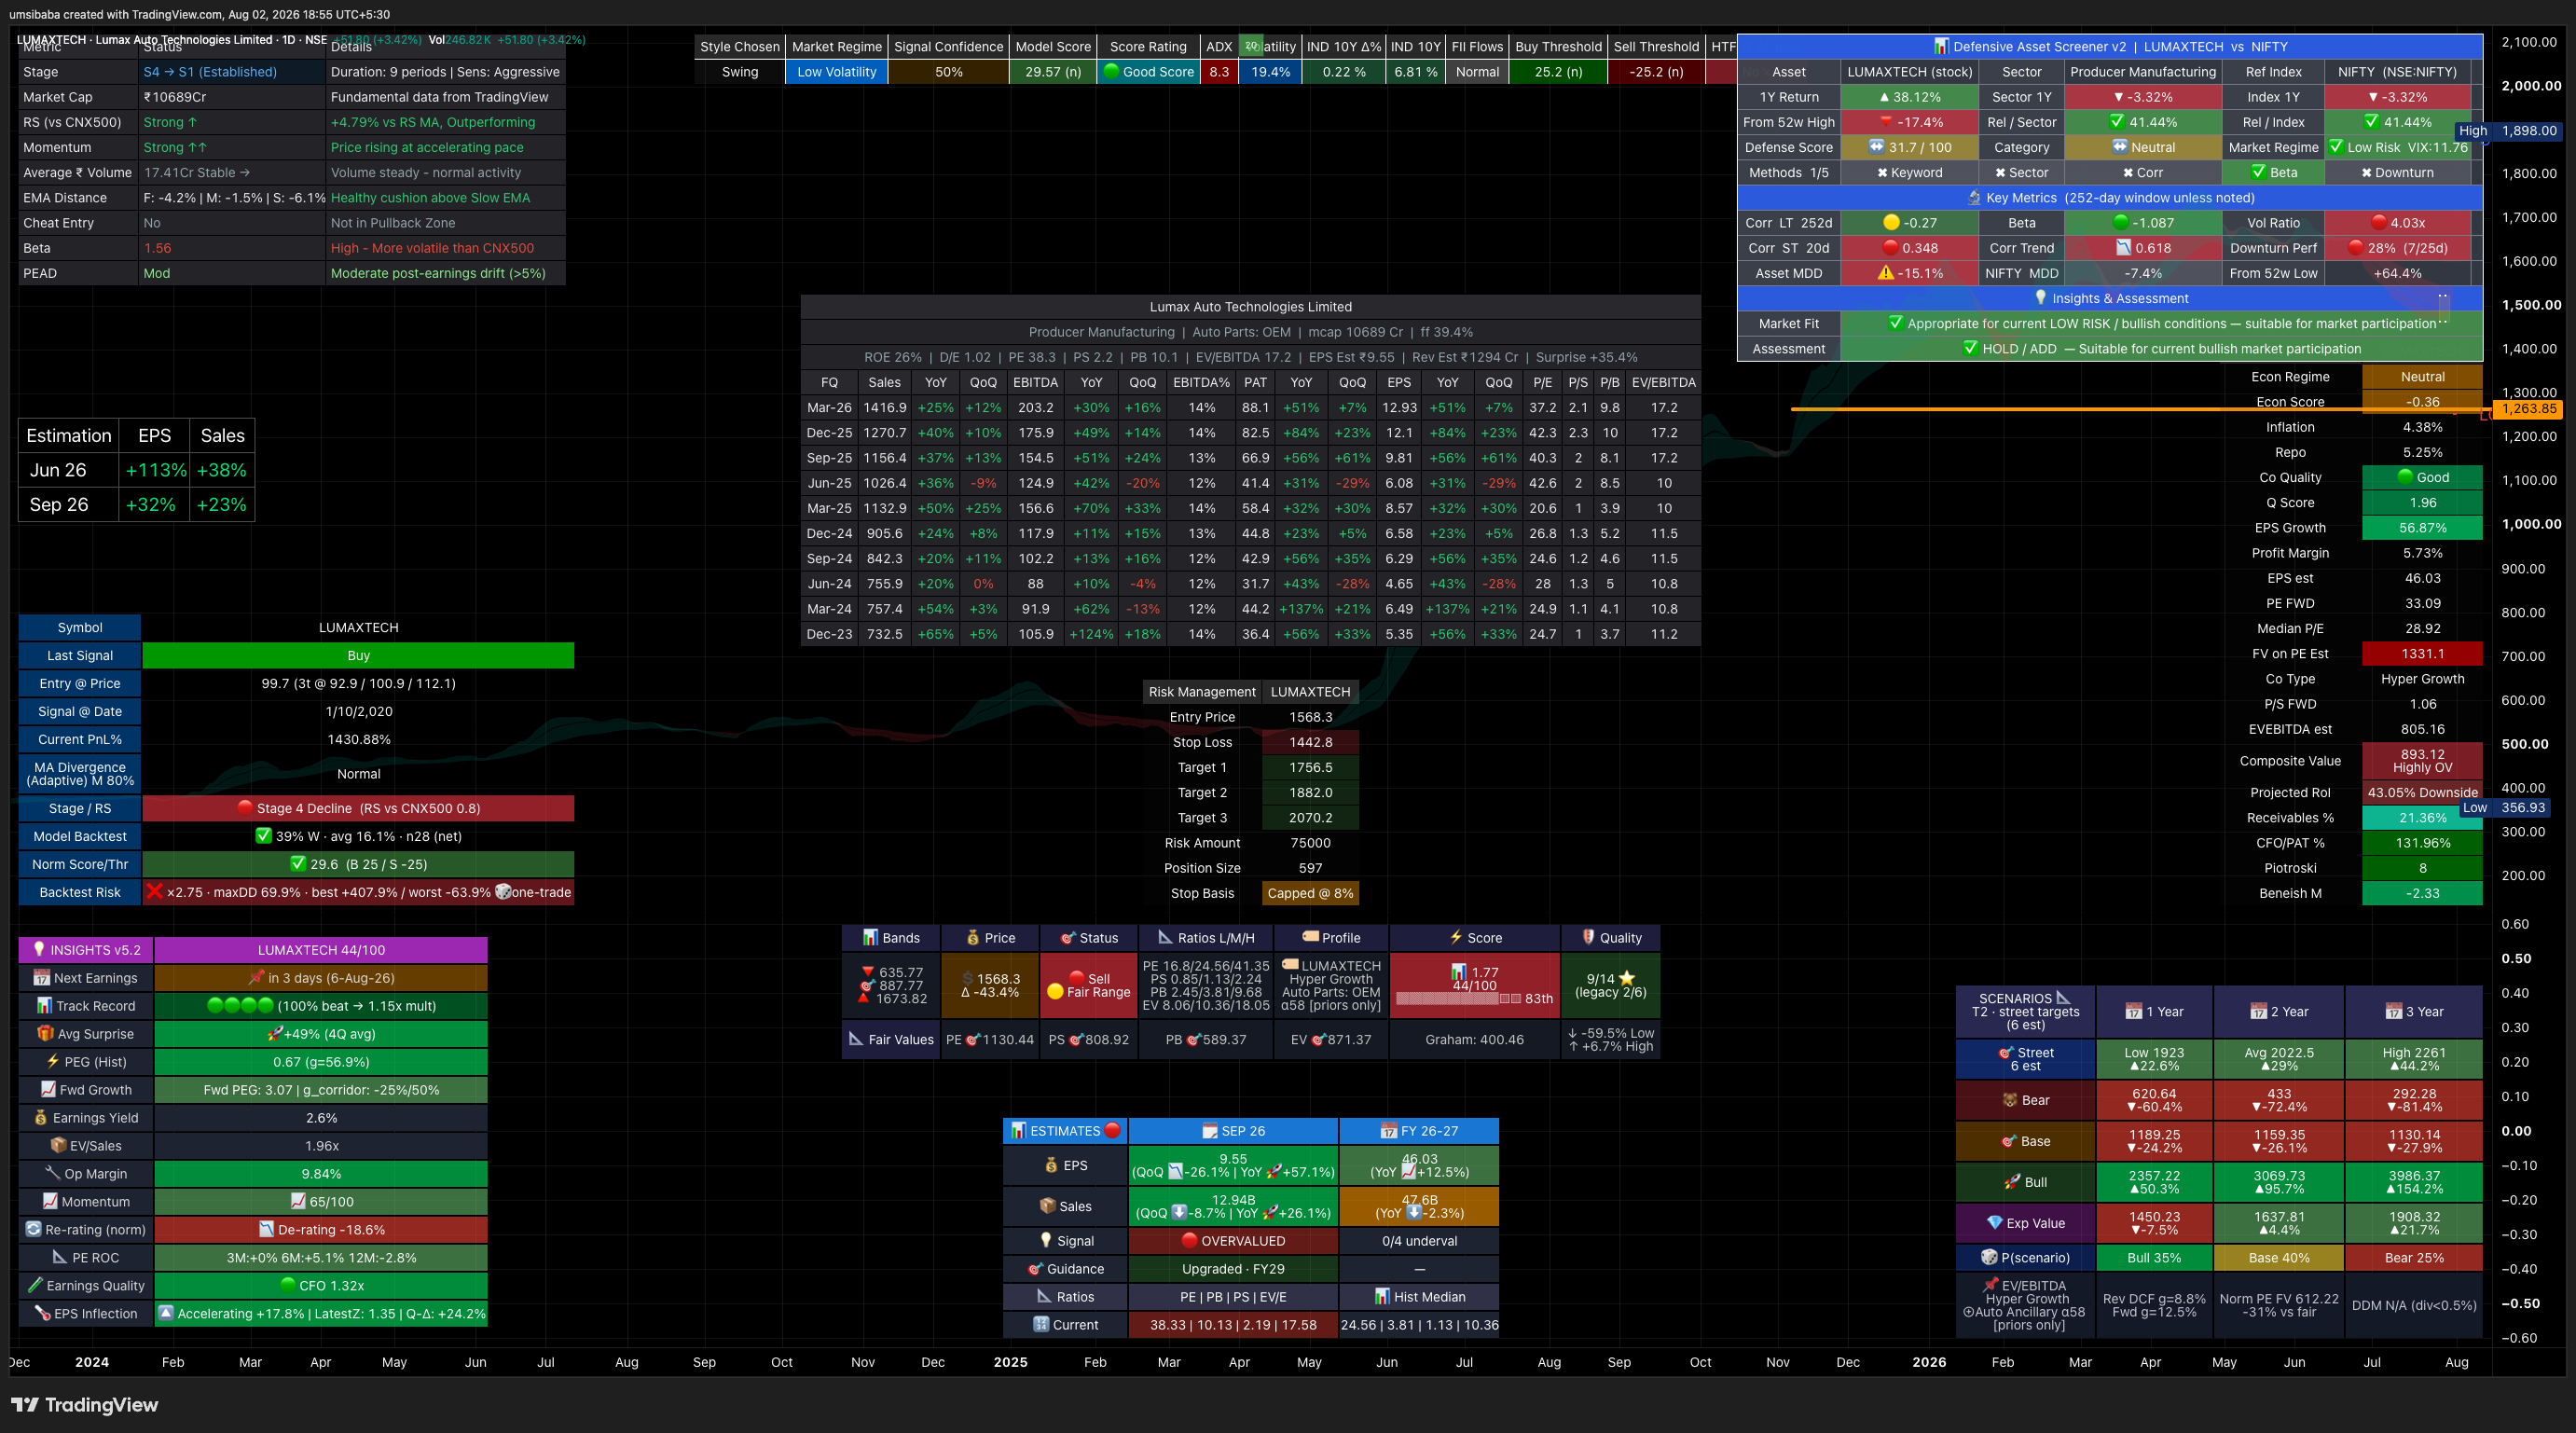
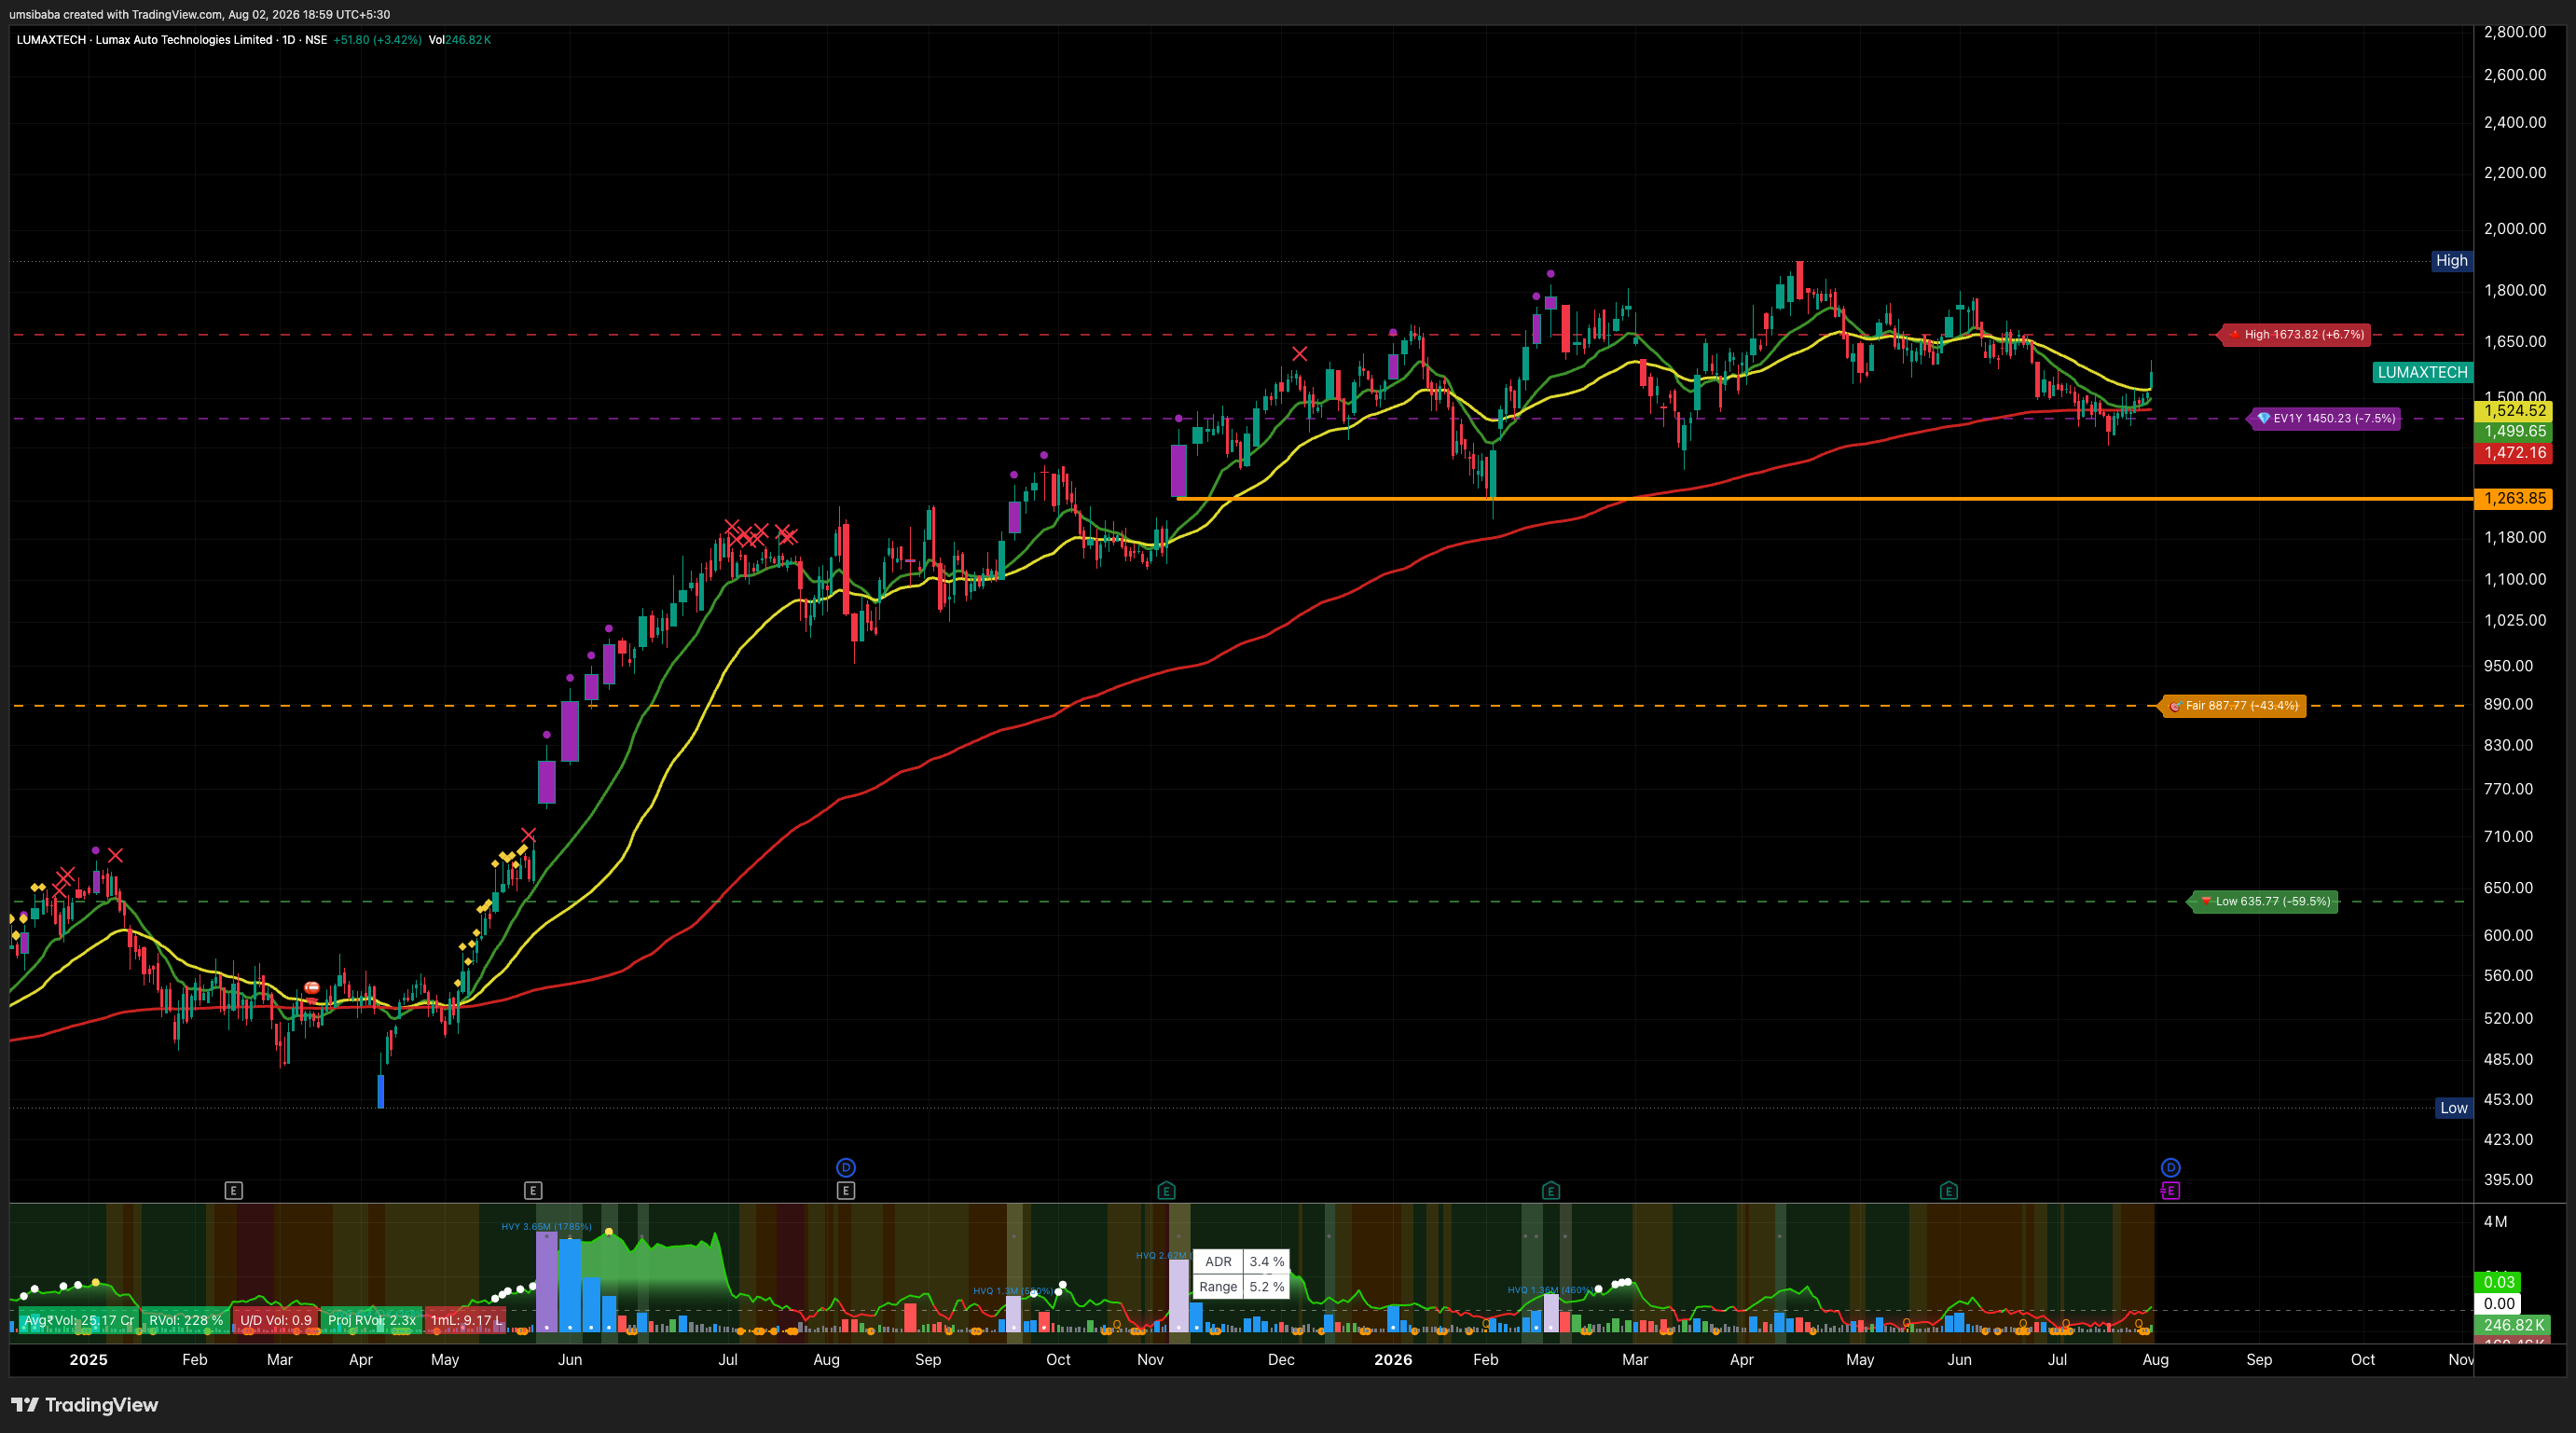
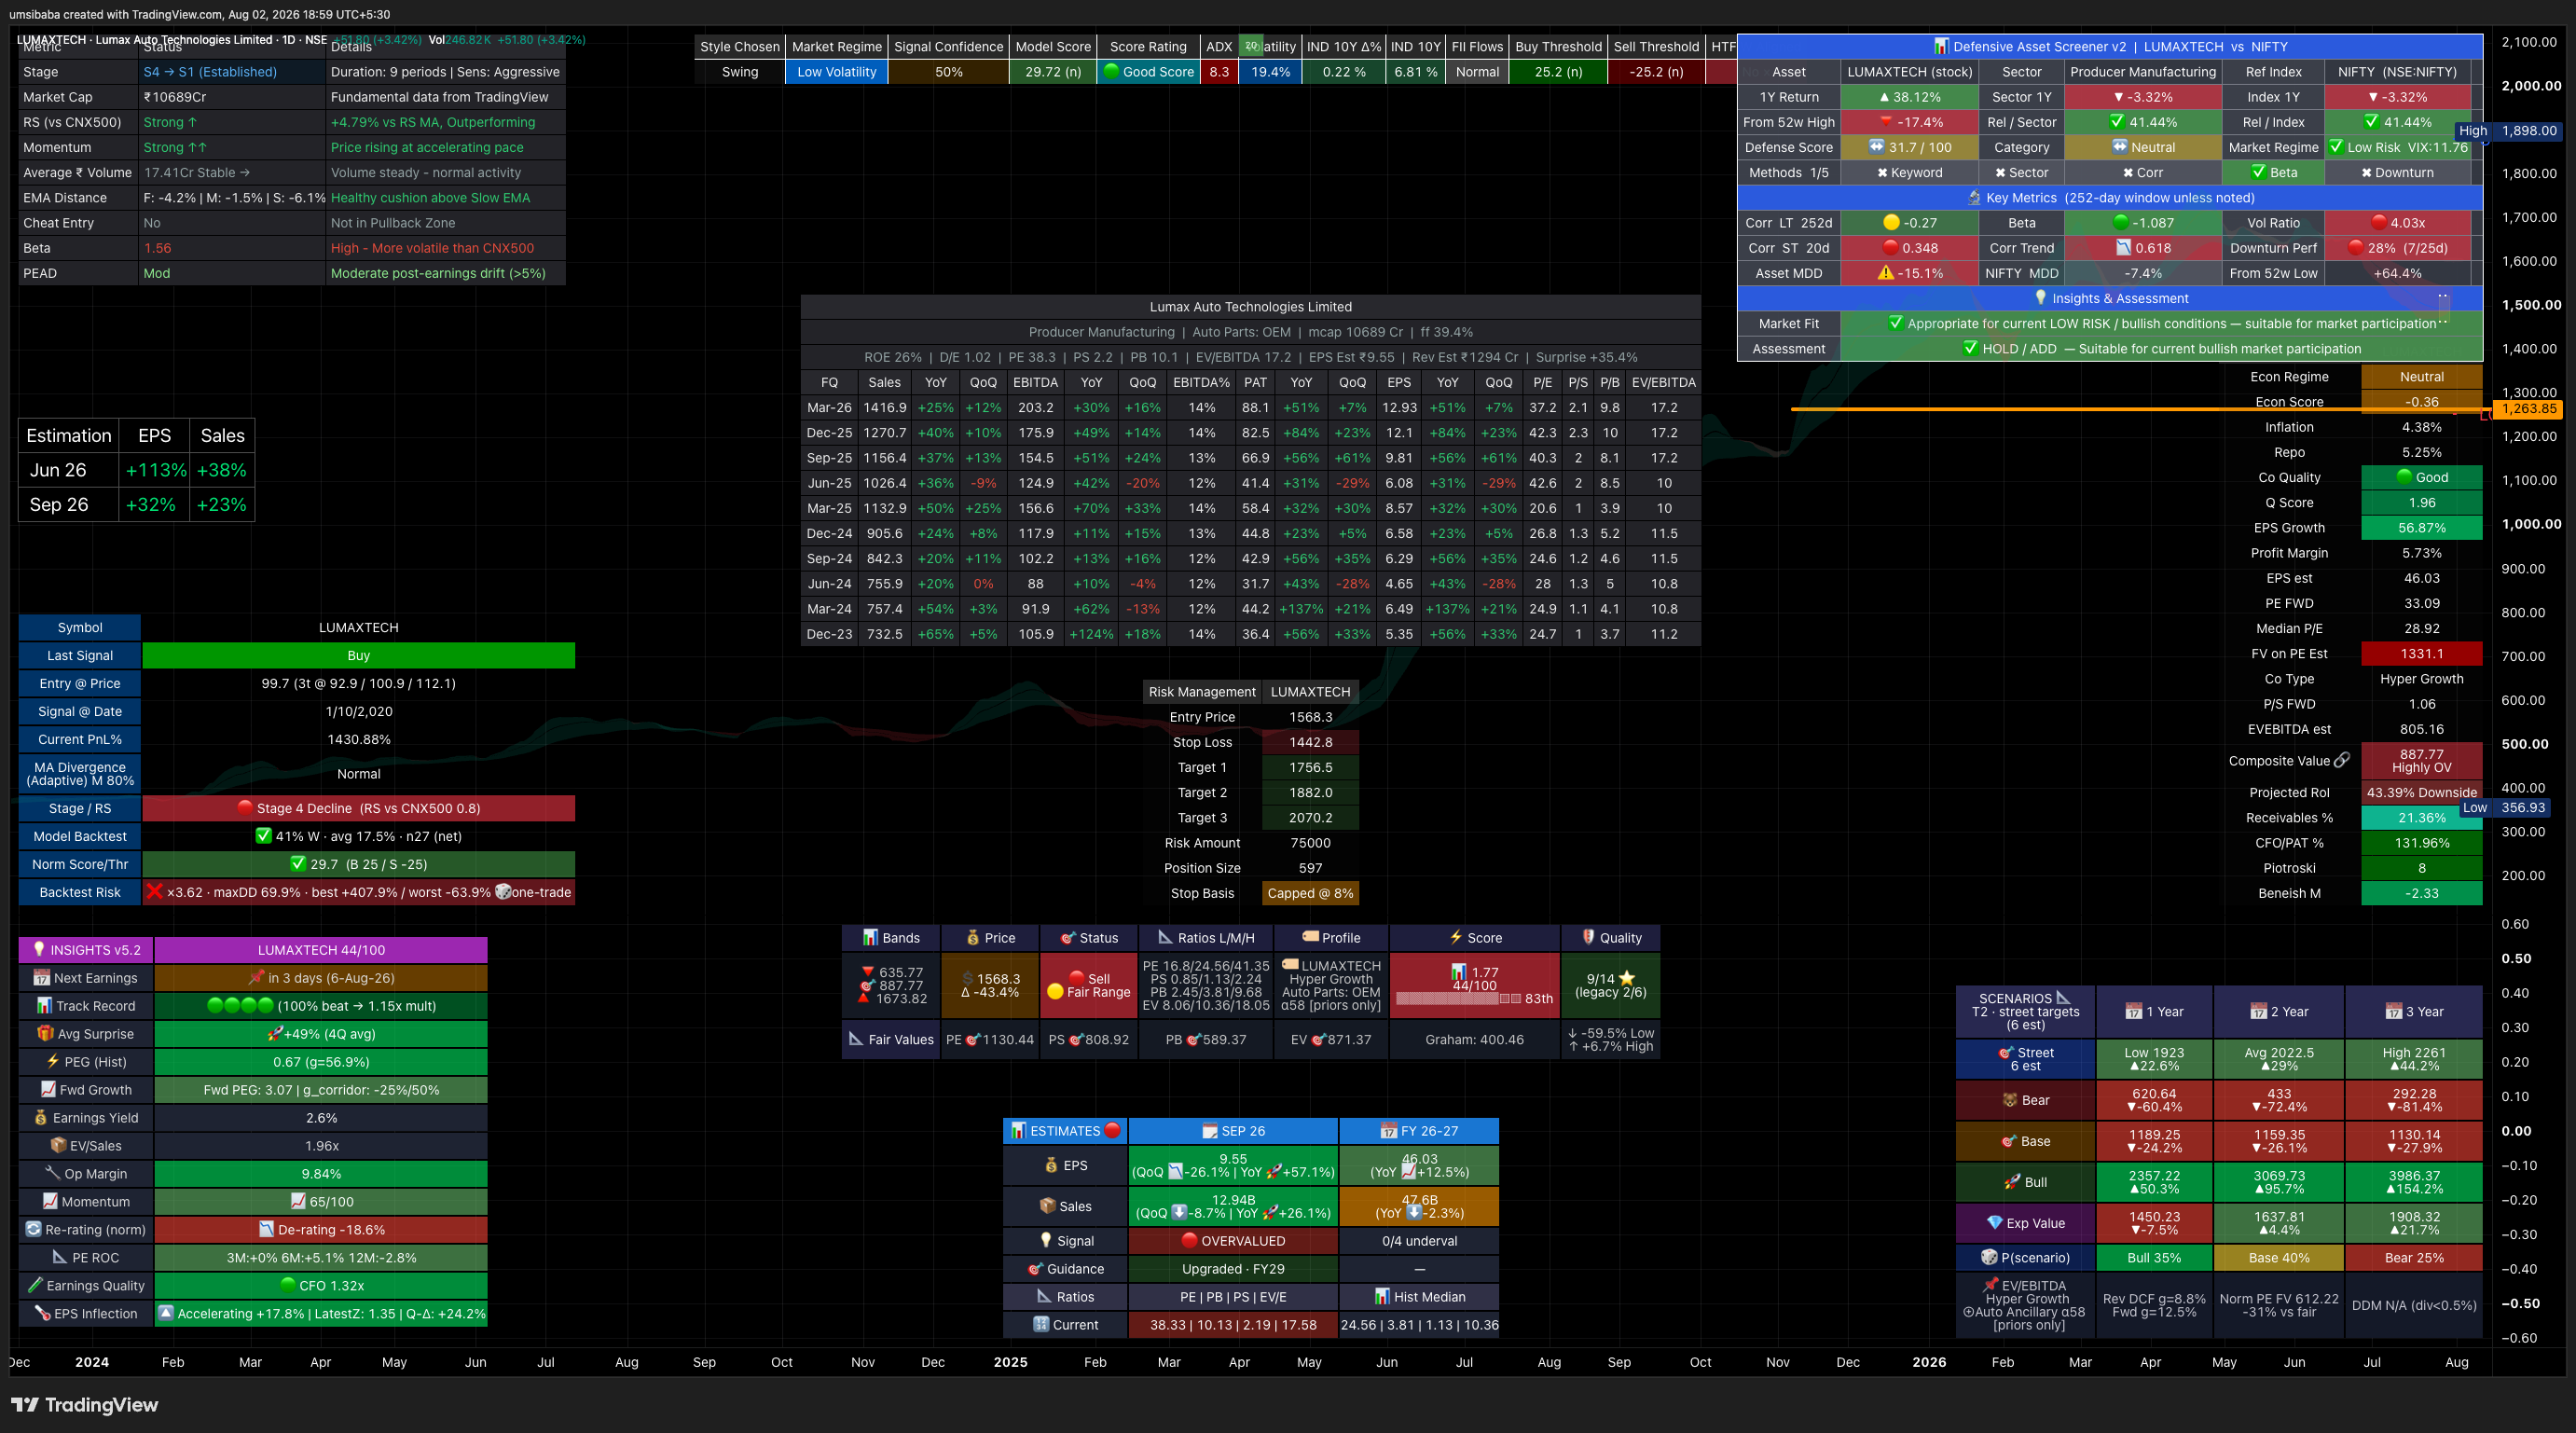
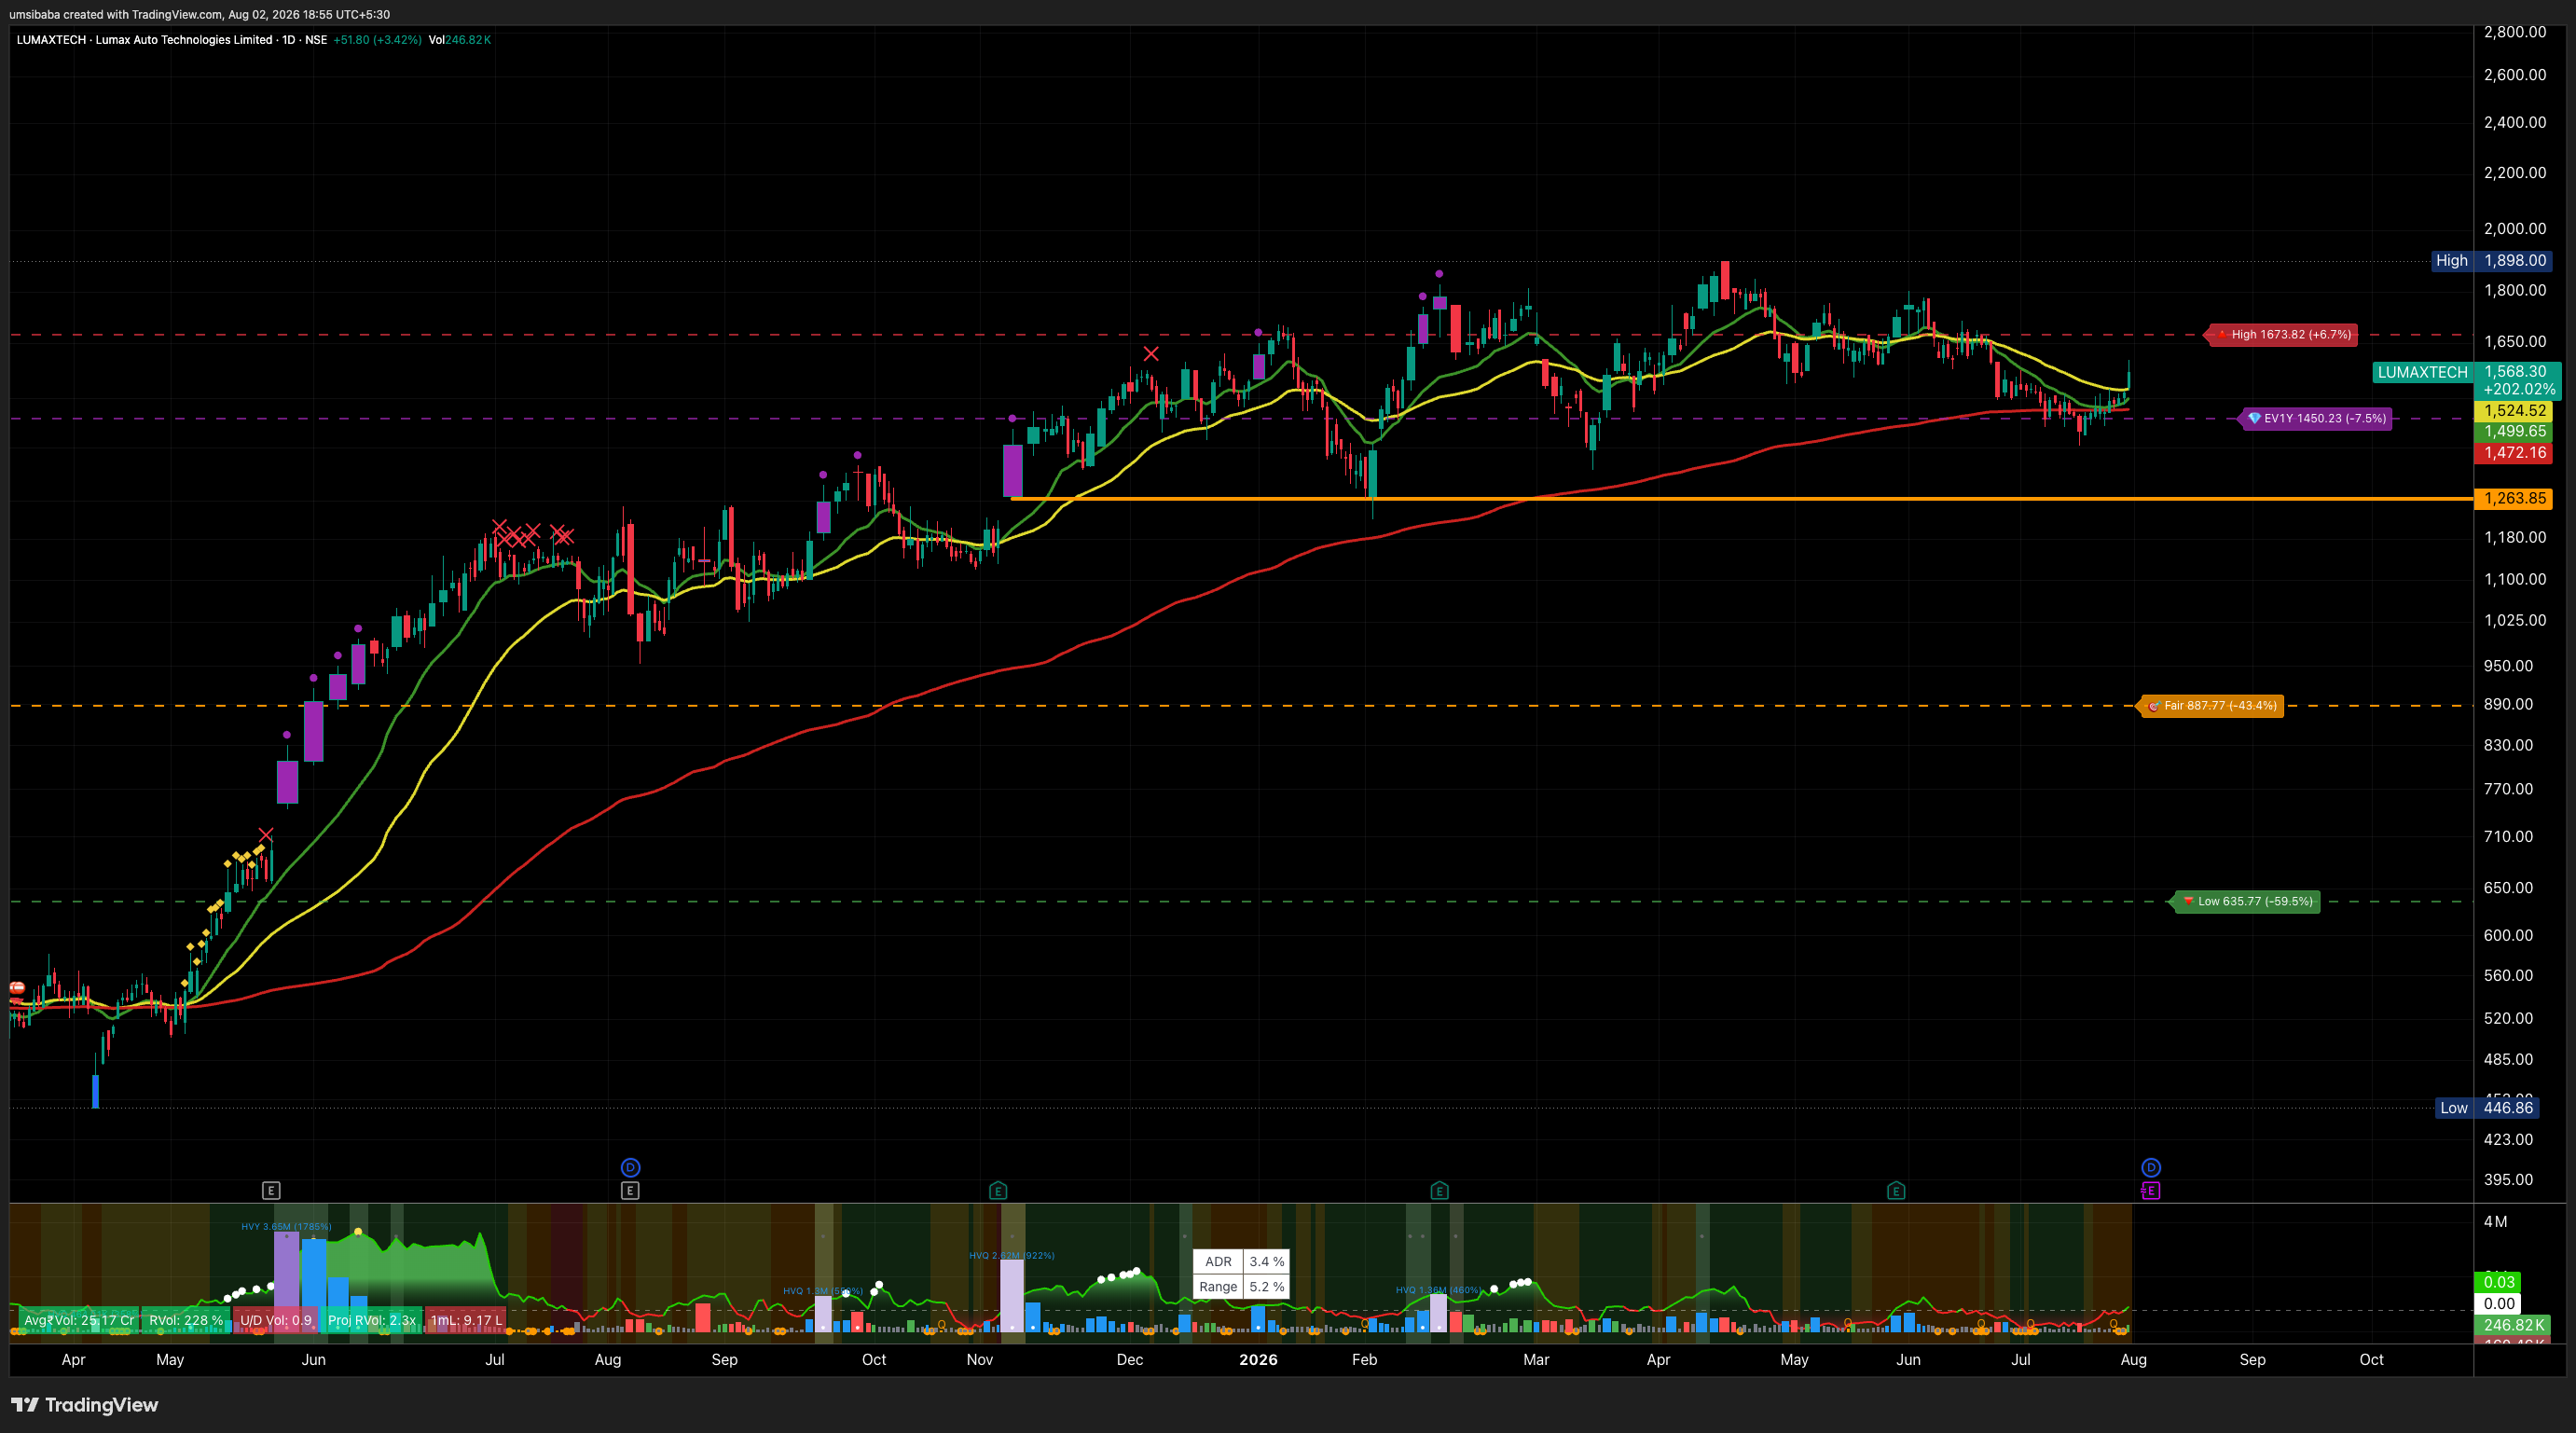
Chart exhibits
as drawn · not updated since
If management delivers what it guided
arithmetic on filed guidance and past valuations · not a price target
LUMAXTECH
FY26 → FY28 · 2 years of guidance · ~1.7 years from today₹1,568 today
BEAR
₹917
-42%-28% a yr
11.6% a year · 18x exit
BASE
₹1,282
-18%-11% a yr
20% a year · 21.8x exit
BULL
₹2,020
+29%+16% a yr
27.2% a year · 30.5x exit
Where the market has priced it
6x38x today39x
- the guided figure reached earnings through a low-confidence bridge
- at 38x its FY26 earnings the stock already trades above the top of its own ten-year range (31x)
How these numbers are produced
| Earnings base | FY26 fiscal year EPS ₹40.91 (screener) |
|---|---|
| Guided growth | 20% a year, said on the call of 05-Jun-2026 · transcript |
| Read across as | operating: unlabelled growth figure, read as revenue — low confidence |
| Delivery calibration | 0.58x / 1x / 1.36x of what was guided — measured: 76 annual guided-vs-filed pairs + 77 near-complete quarterly years — NSE transcripts against the companies' own filings |
| Exit multiple | 18x / 21.77x / 30.52x, this company’s own p20 / median / p80 across 10 filed years |
| Filed-industry peers | median 25.12x across 38 peers — the cross-check, not the input |
| Arithmetic | base EPS × (1 + guided growth × delivery)2 × exit multiple |
Arithmetic on management’s own guidance and this company’s own past valuations. Not a price target, not a recommendation, and not a forecast of what the stock will do.
Price chart
260 sessions to 31 Jul 2026 ·
daily close ·
our own broker data