KRN
KRN Heat Exchanger (KRN)
Latest view
Constructive
as of 4 Mar 2026 · not a recommendation
Evidence timeline
4 Mar
2026
2026
KRN Heat Exchanger (KRN) — Investment Thesis 2026
Constructive/r/thesis/KRN_2026-03-04.html
4 Mar
2026
2026
KRN — Thesis
—/r/thesis/KRN_2026-03-04.pdf
What management said
from NSE earnings-call filings · extracted, not interpreted
generic growth 90.0%
Of course, in fin and tube especially we will be expecting I think more than 80% or 90% growth especially from data center only.
Call 20-May-2026 · transcript PDF
Outlook, as stated
Yadav, I know you don't give guidance, but if I do a rough math of around INR1800 crore revenue potential from the new capacity, which leads to around INR350 crore revenue from the new facility in FY '26 itself.
Just one question, you mentioned that you will be able to achieve capacity utilization of 20% in FY '26 and the maximum revenue peak revenue from this new capacity will be around INR2,000 crores.
Santosh Kumar Yadav: So, still like paper is not in front of me, but roughly you can say I think maybe Rs.30 crores to Rs.40 crores will be there.
4.82
concrete references per 100 words spoken — counts, currency, units and
named periods, not adjectives
Chart exhibits
as drawn · not updated since
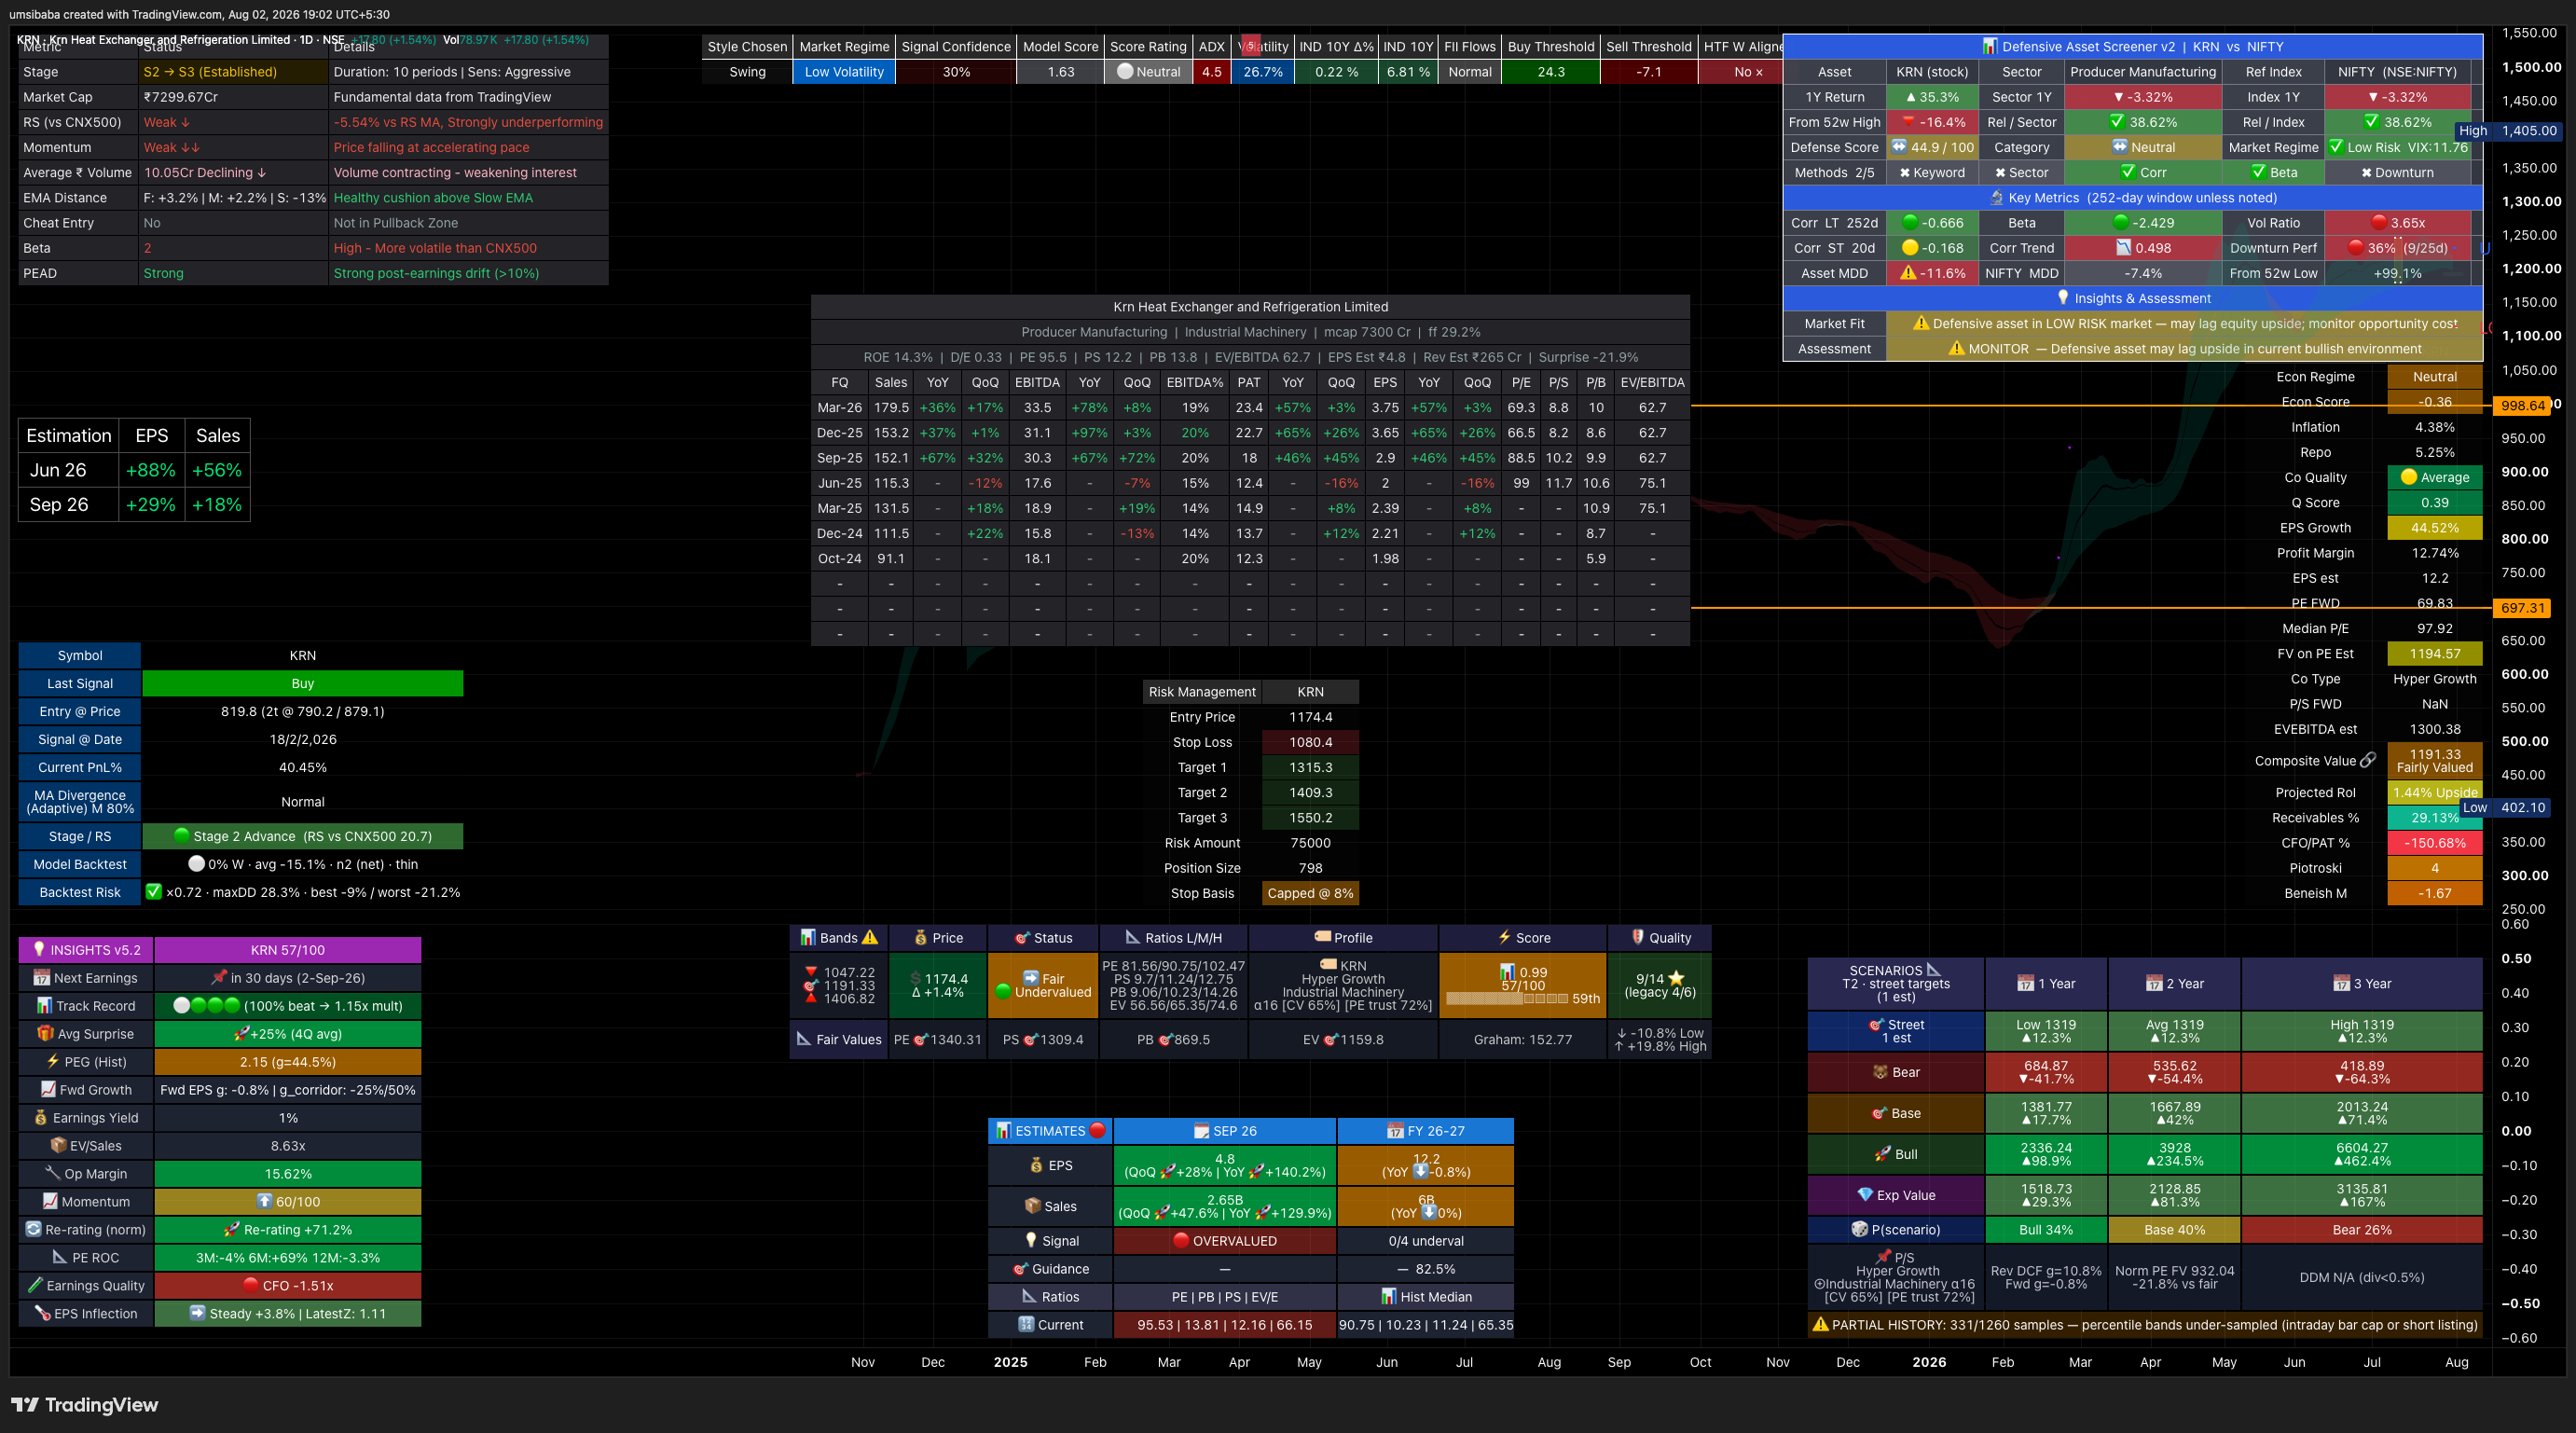
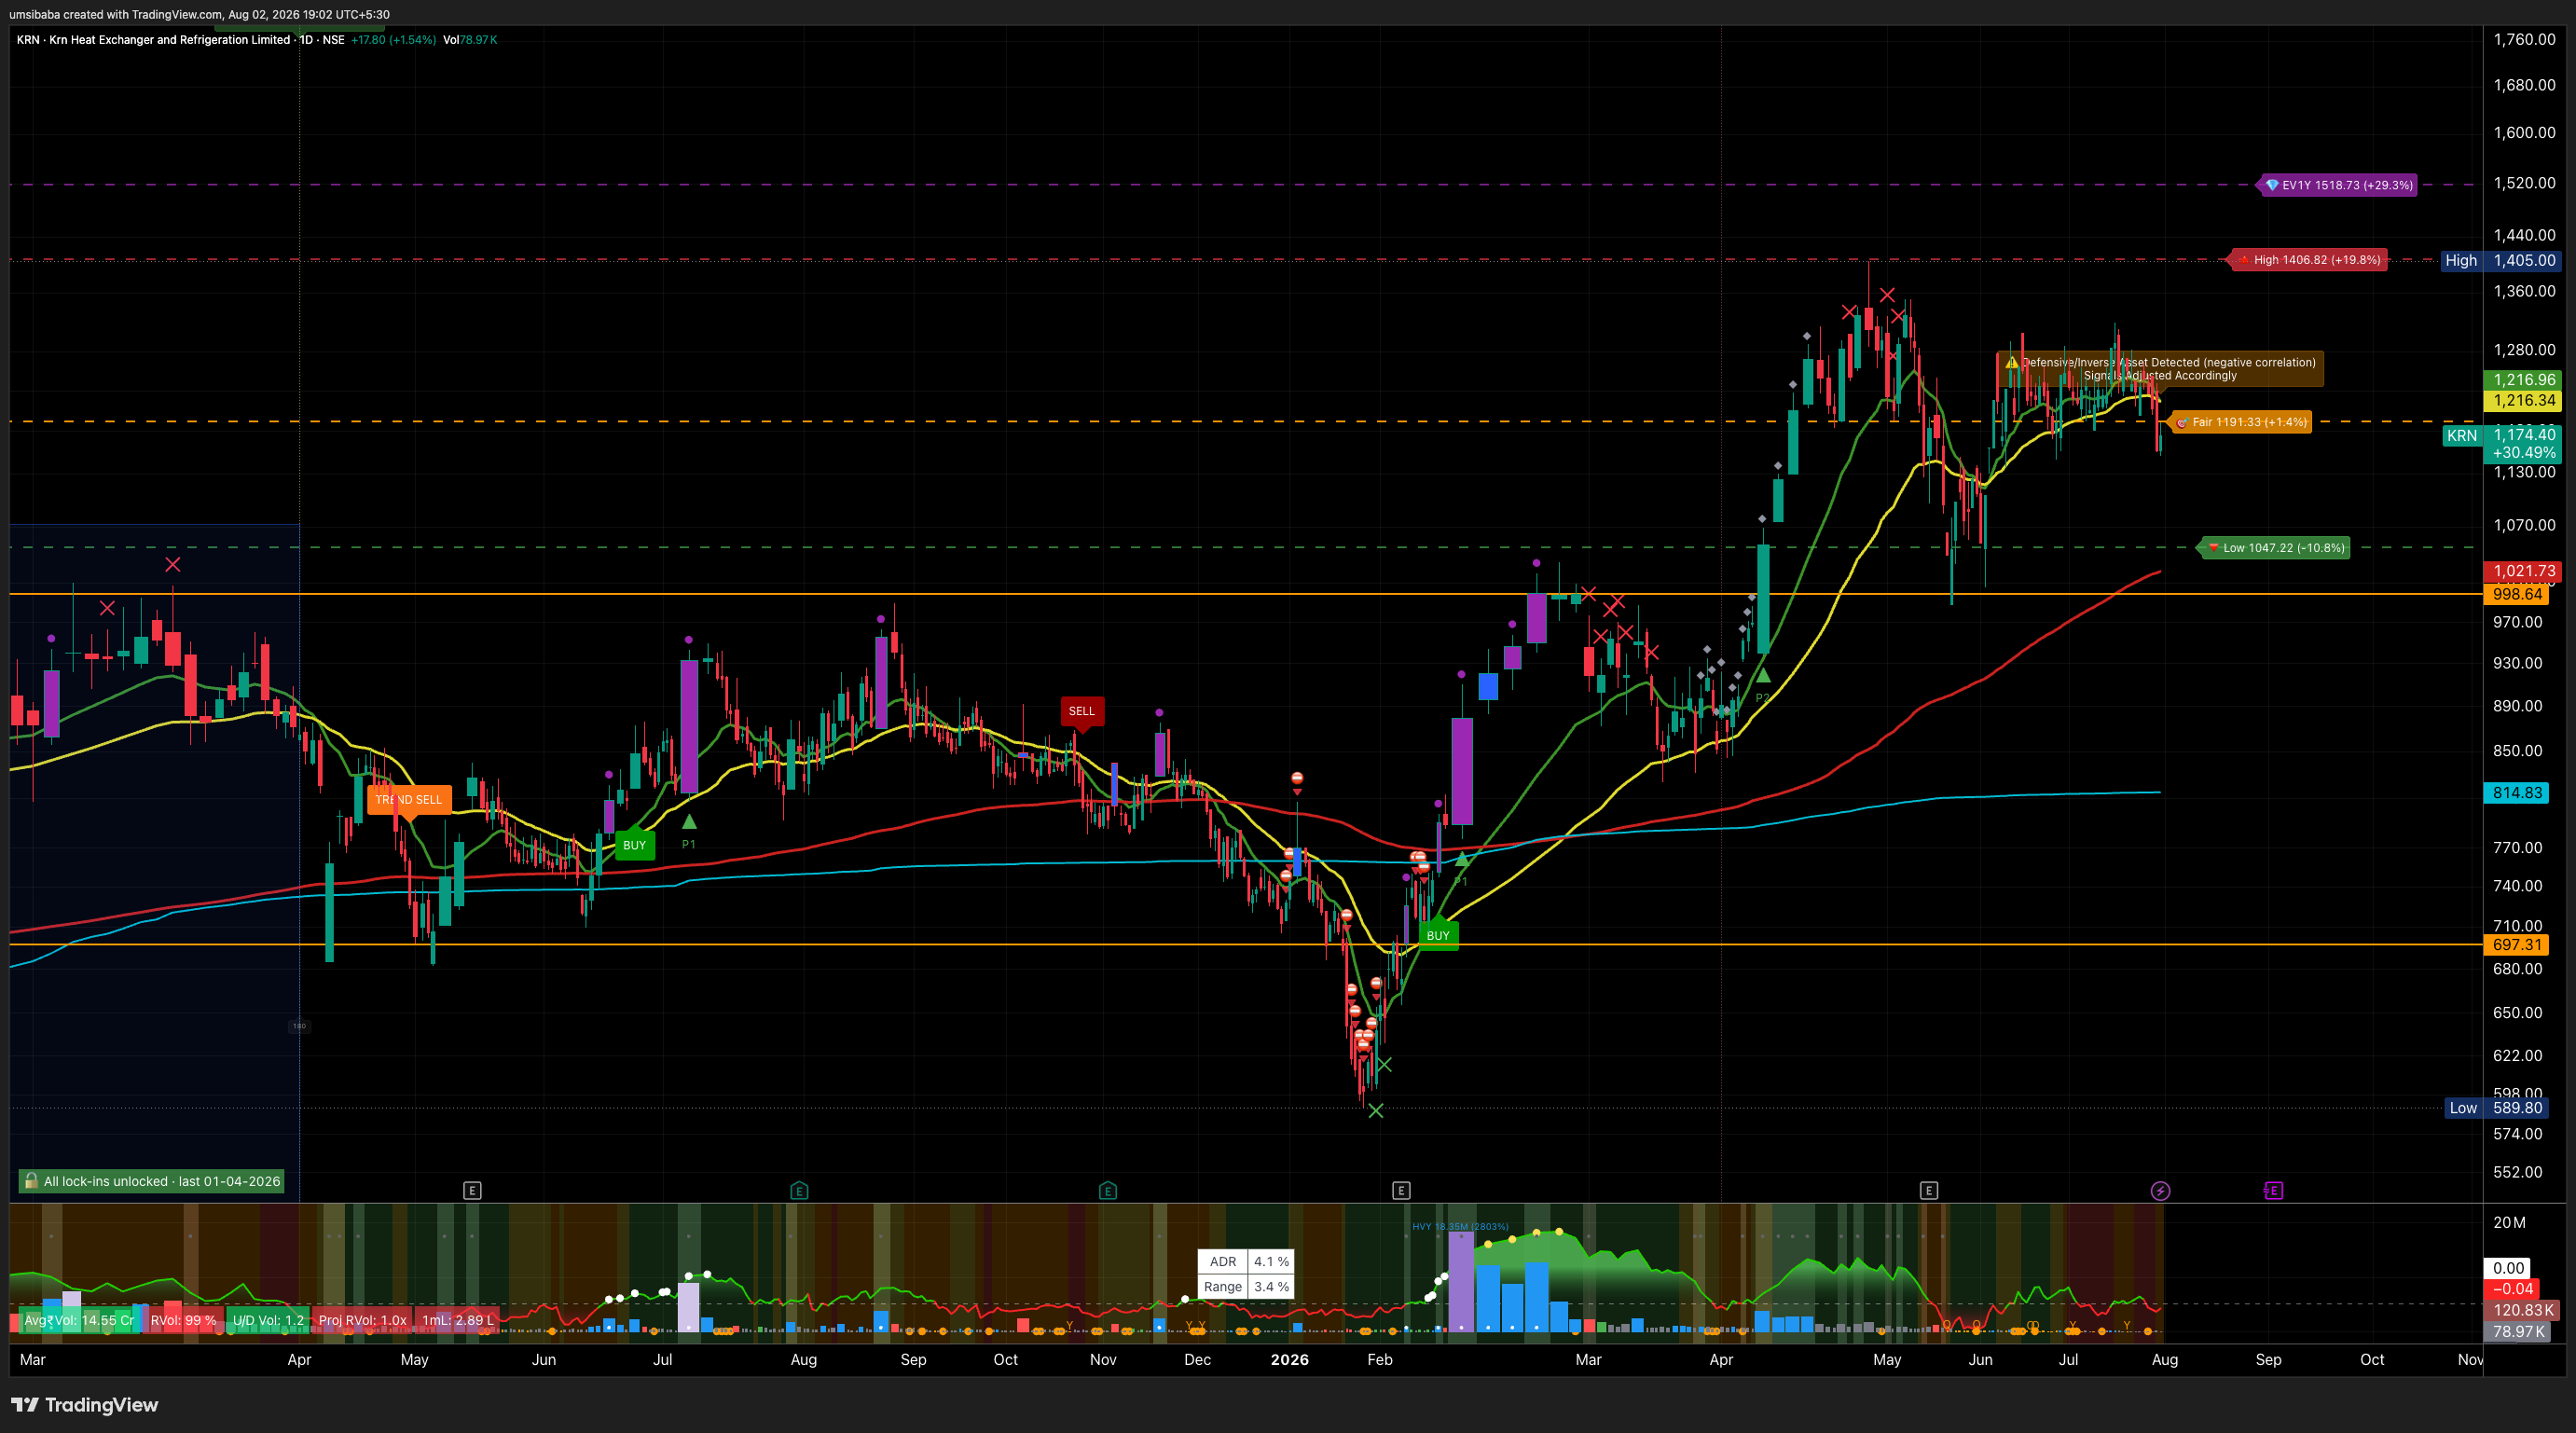
If management delivers what it guided
arithmetic on filed guidance and past valuations · not a price target
KRN
FY26 → FY27 · 1 year of guidance · ~0.7 years from today₹1,174 today
BEAR
₹322
-73%
47.7% a year · 17.7x exit
BASE
₹633
-46%
82.5% a year · 28.2x exit
BULL
₹1,590
+35%
112.2% a year · 61x exit
Where the market has priced it
7x96x today — outside the range95x
management named no year; shown one year out
- the guided figure reached earnings through a low-confidence bridge
- this company has too little filed history for a multiple band of its own, so the exit multiple is the median of 31 Industrial Machinery peers
- at 96x its FY26 earnings the stock already trades above the top of its own ten-year range (61x)
- the range is unusually wide — read it as the span of management's own claim, not as a forecast
How these numbers are produced
| Earnings base | FY26 TTM EPS ₹12.29 (universe (TradingView, diluted TTM)) |
|---|---|
| Guided growth | 82.5% a year, said on the call of 20-May-2026 · transcript |
| Read across as | operating: unlabelled growth figure, read as revenue — low confidence |
| Delivery calibration | 0.58x / 1x / 1.36x of what was guided — measured: 76 annual guided-vs-filed pairs + 77 near-complete quarterly years — NSE transcripts against the companies' own filings |
| Exit multiple | 17.71x / 28.23x / 61x, this company’s own p20 / median / p80 across 31 filed years |
| Filed-industry peers | median 28.23x across 31 peers — the cross-check, not the input |
| Arithmetic | base EPS × (1 + guided growth × delivery)1 × exit multiple |
Arithmetic on management’s own guidance and this company’s own past valuations. Not a price target, not a recommendation, and not a forecast of what the stock will do.
Price chart
260 sessions to 31 Jul 2026 ·
daily close ·
our own broker data