EMSLIMITED
EMS Ltd (EMSLIMITED)
Latest view
Passed
as of 1 Aug 2026 · not a recommendation
Evidence timeline
What management said
from NSE earnings-call filings · extracted, not interpreted
Call 17-Feb-2026 · transcript PDF
Outlook, as stated
Otherwise, seeing the scope of work, we could have grown with the 50% also but 25% to 30% growth is our target because we do not want to take any debt.
As far as annual projections are concerned, we are still promising for the delivery of the 18%, 20% annual growth in comparison to FY '25.
800 crores, then I will be able to do 25% to 30% of that because it will take some time for me in approvals, drawings, etcetera.
6.01
concrete references per 100 words spoken — counts, currency, units and
named periods, not adjectives
Chart exhibits
as drawn · not updated since
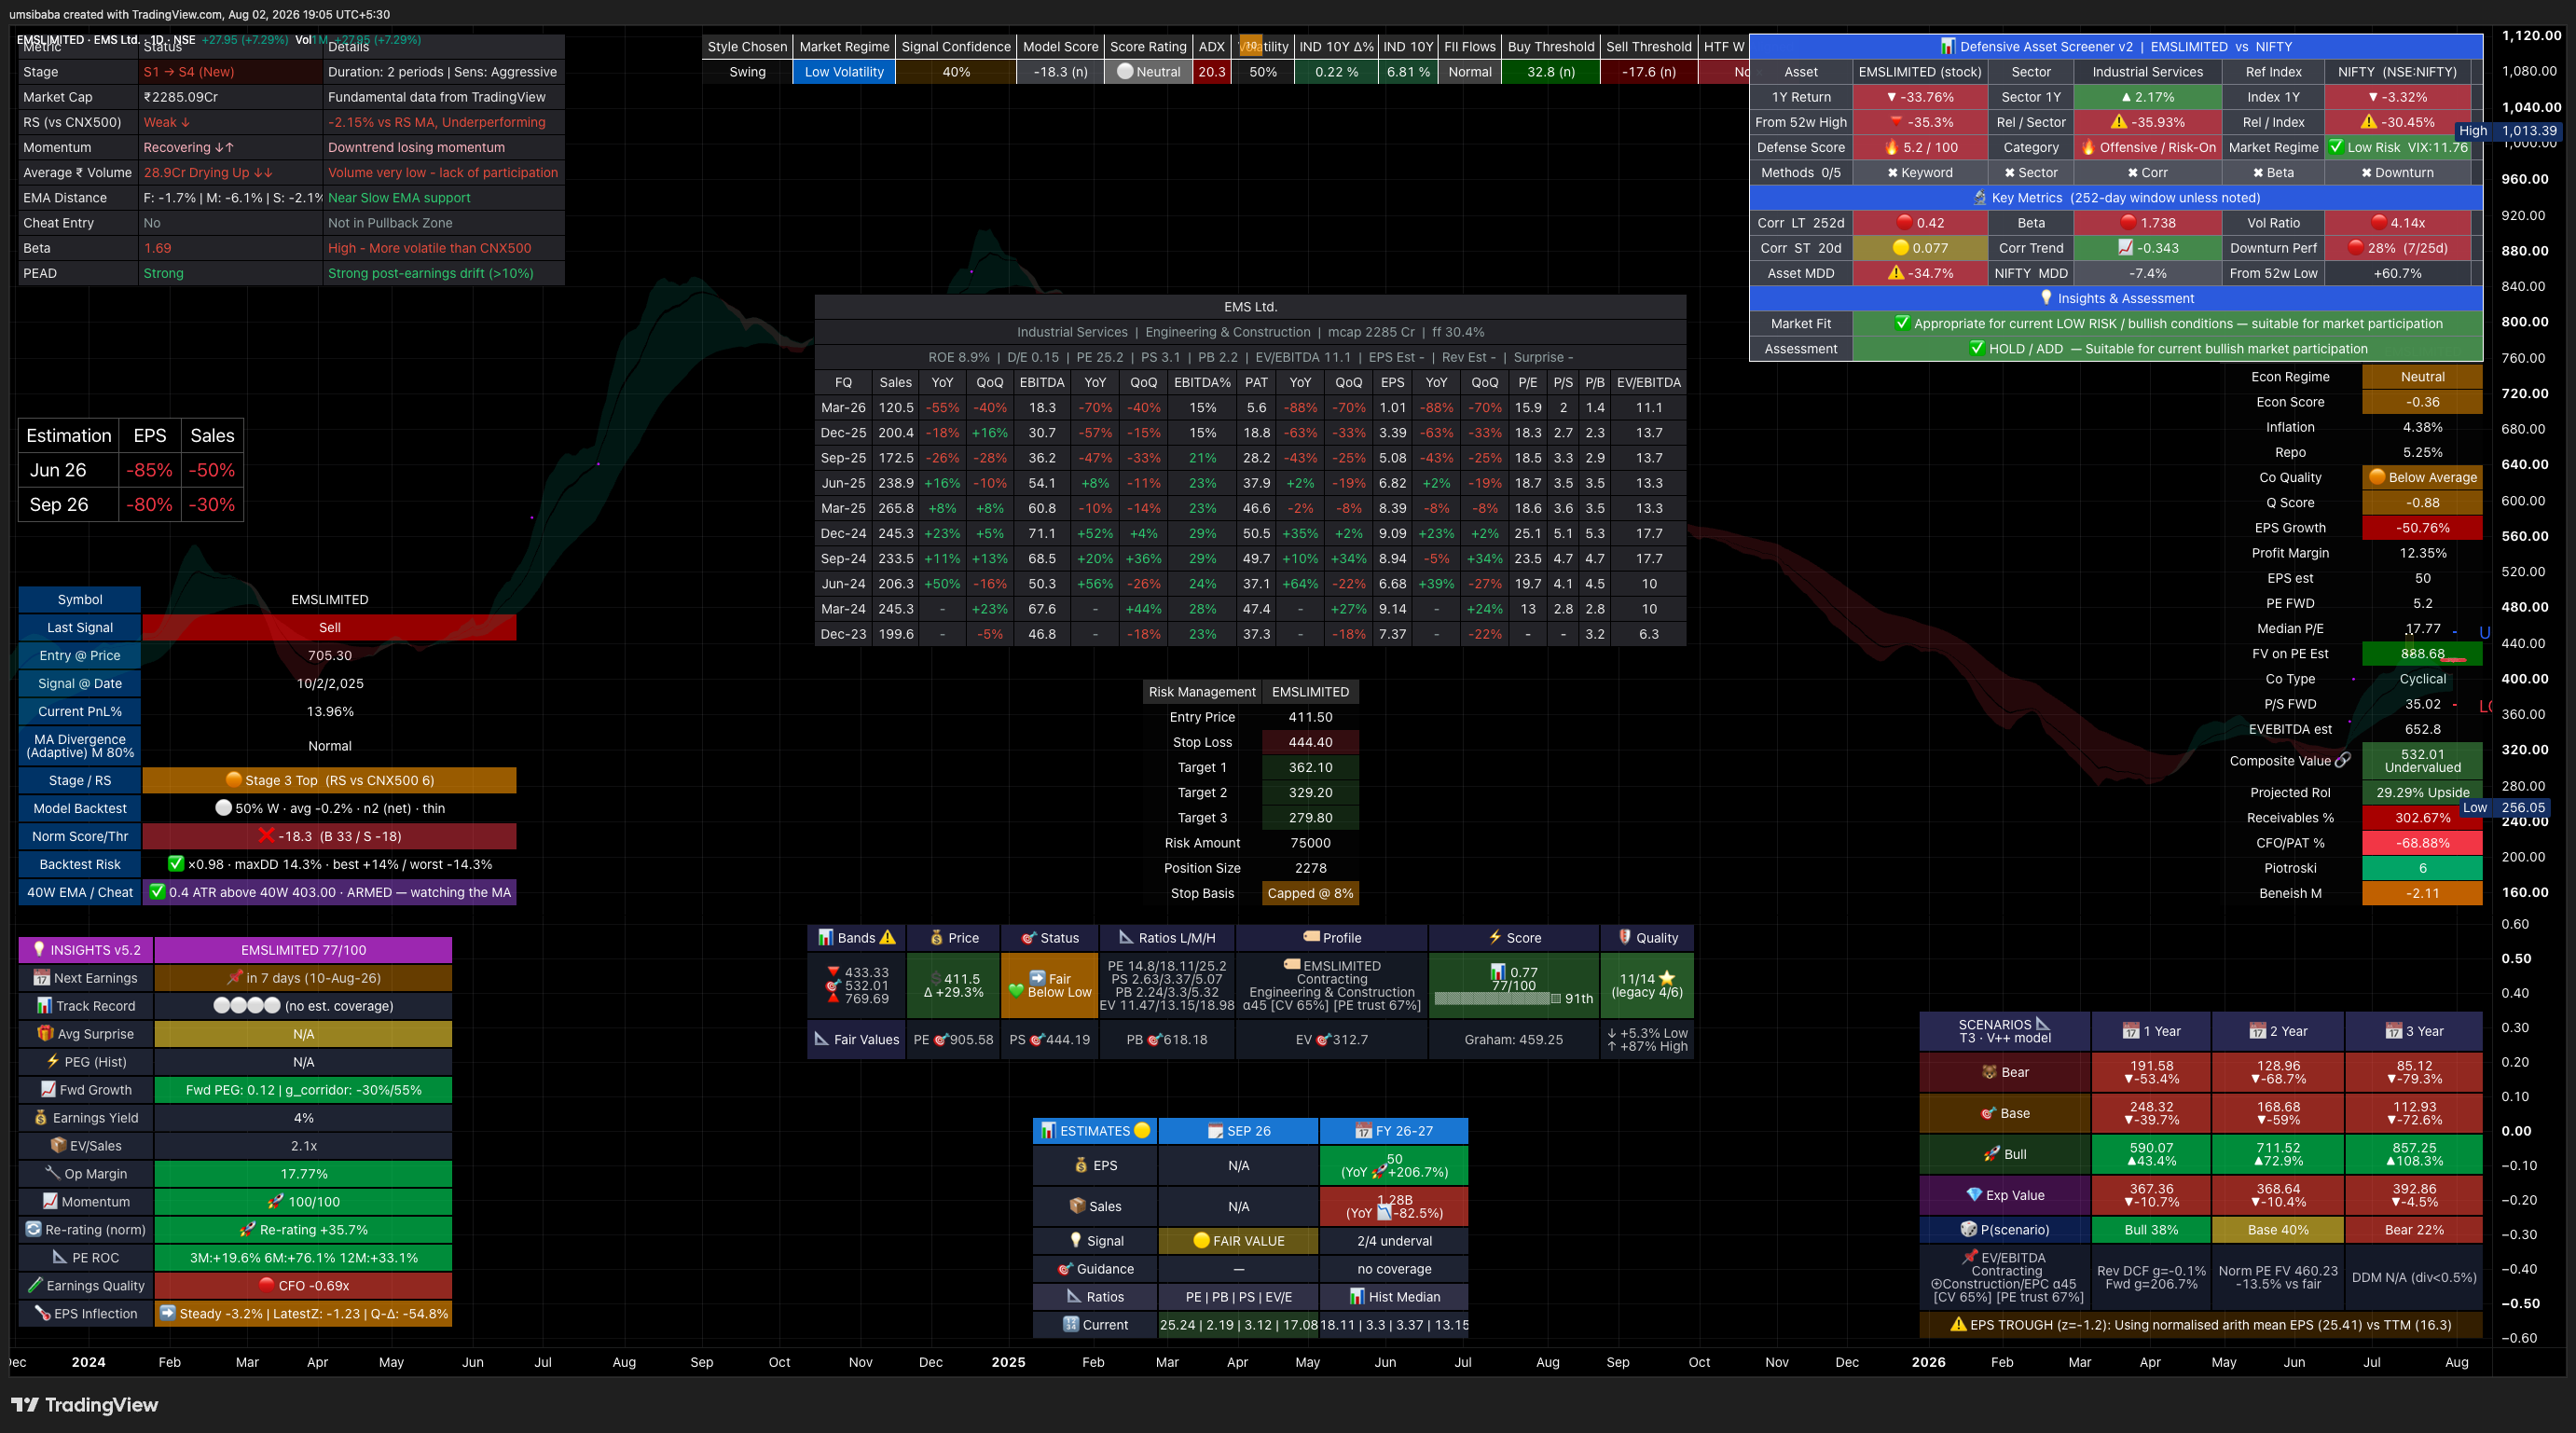
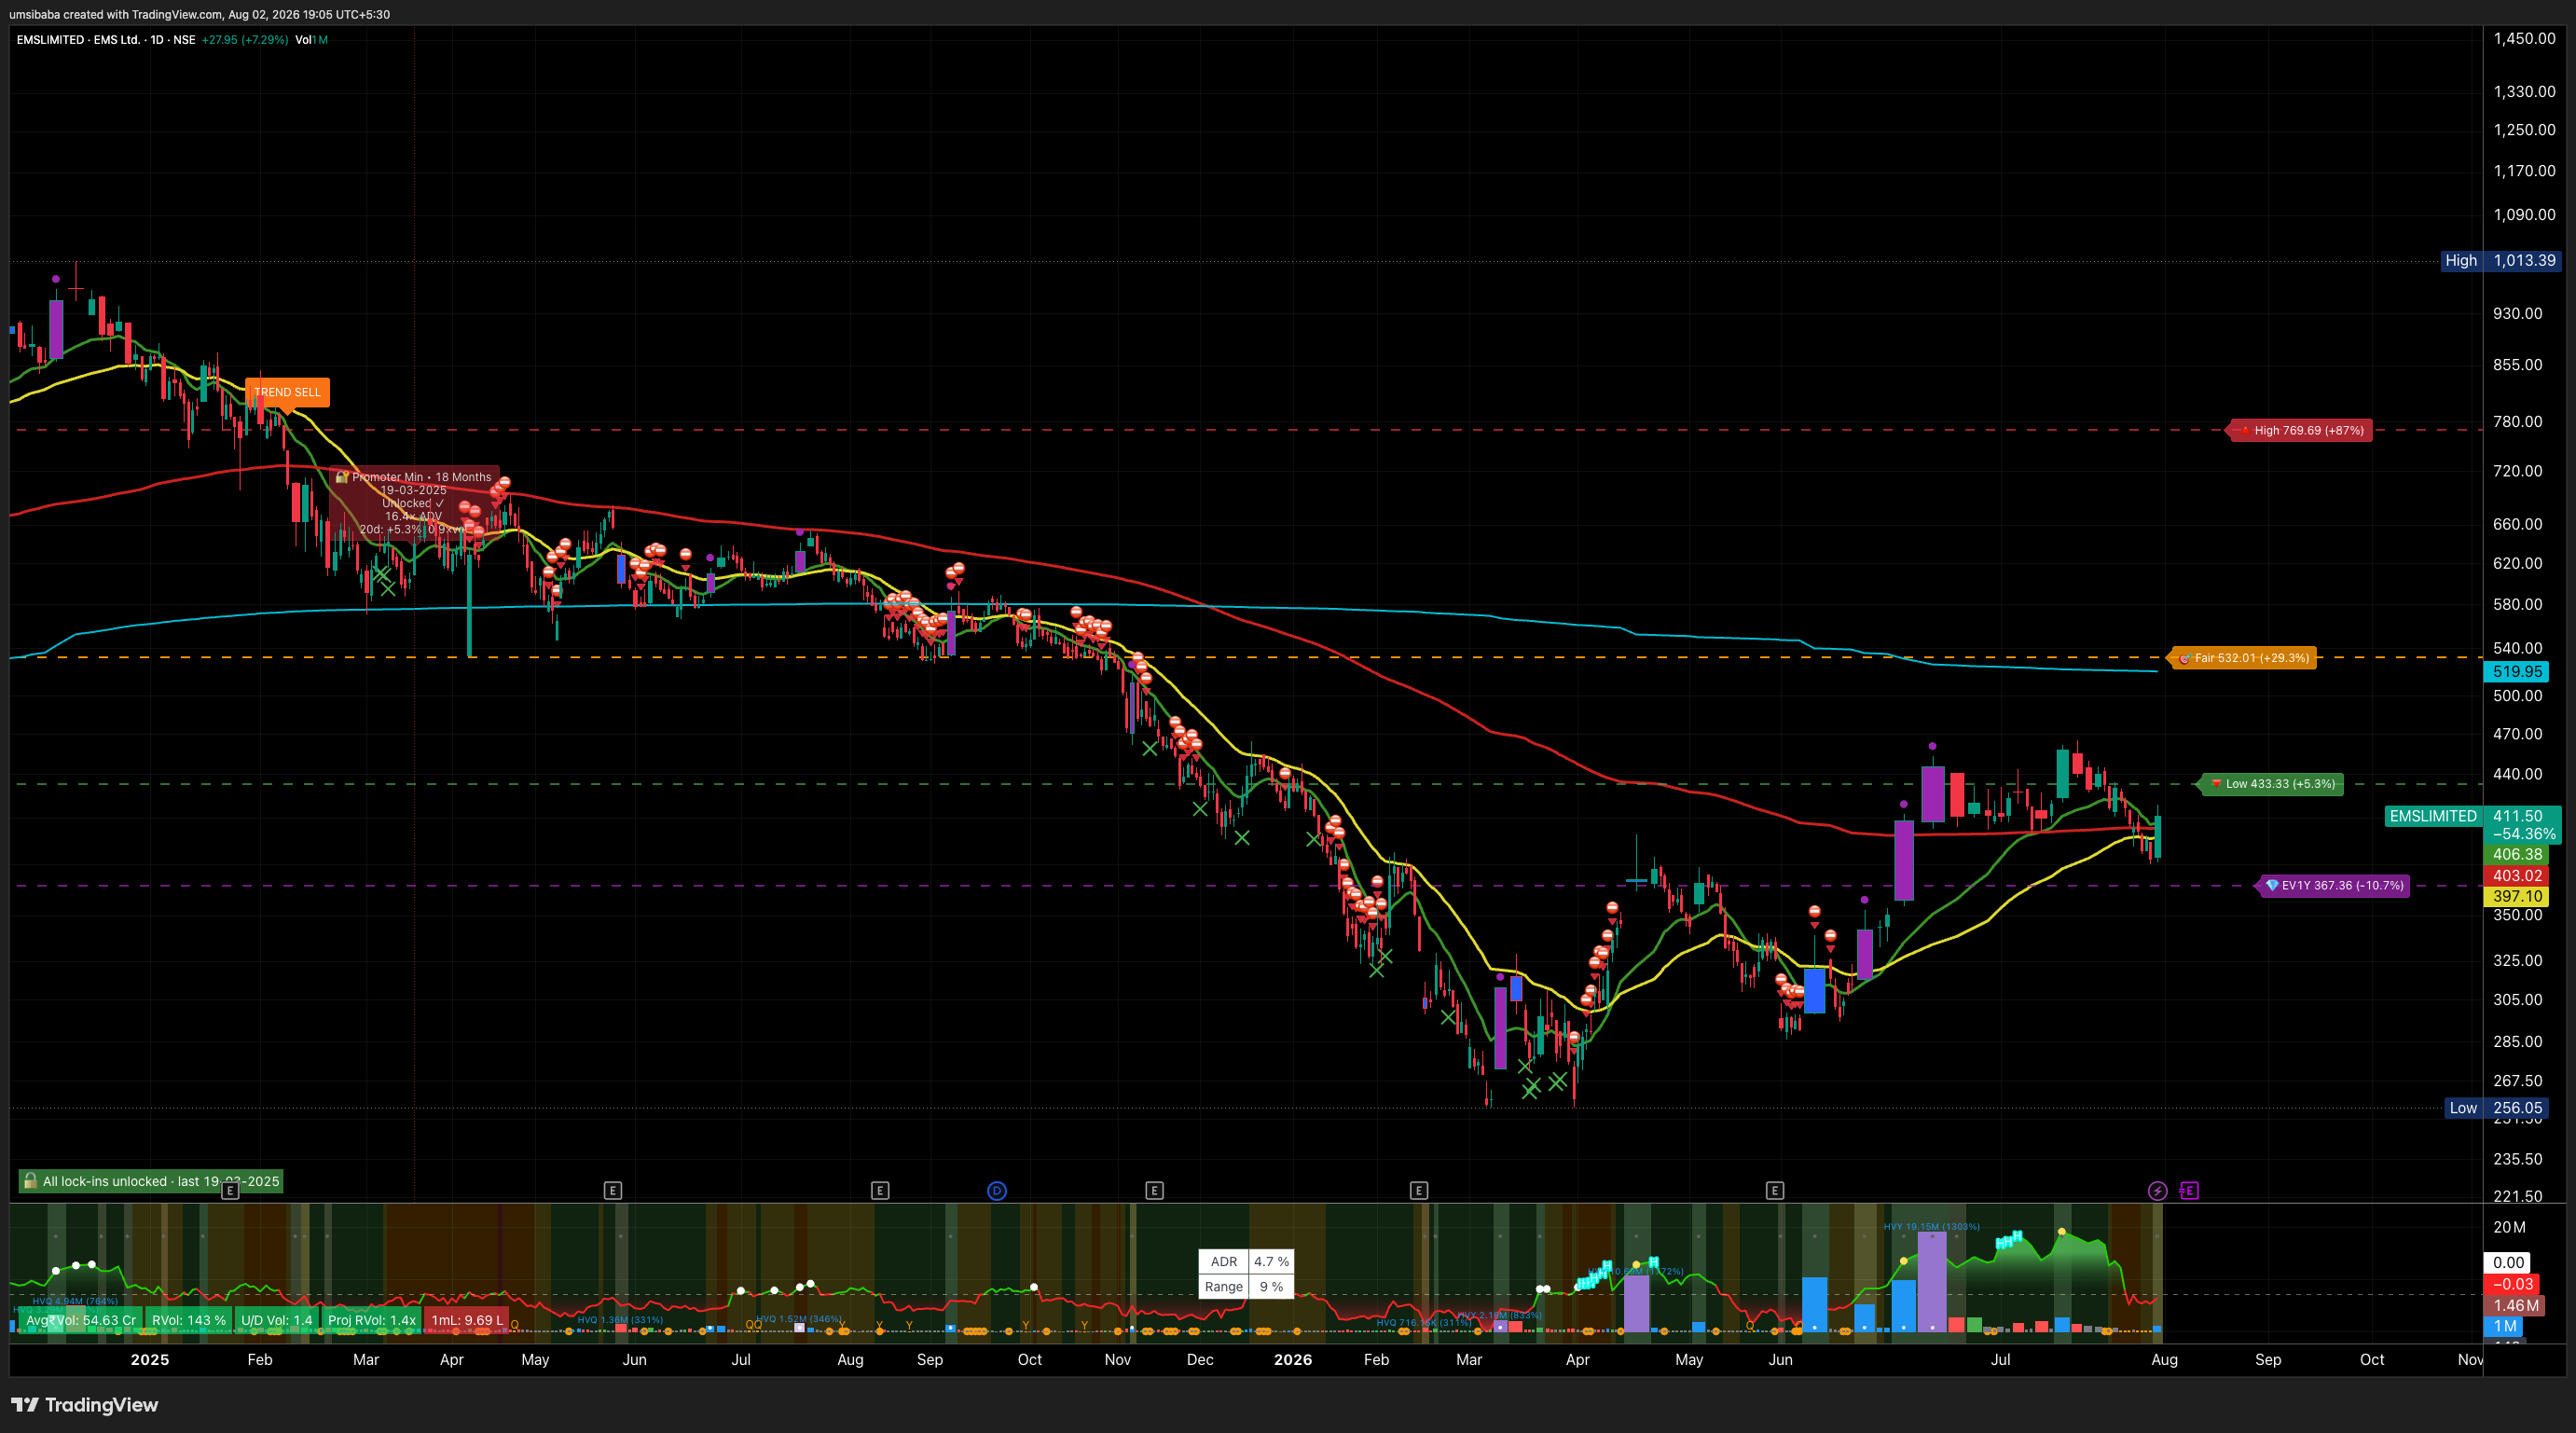
If management delivers what it guided
arithmetic on filed guidance and past valuations · not a price target
EMSLIMITED
FY26 → FY27 · 1 year of guidance · ~0.7 years from today₹412 today
BEAR
₹227
-45%
11.6% a year · 12.5x exit
BASE
₹313
-24%
20% a year · 16x exit
BULL
₹422
+3%
27.2% a year · 20.4x exit
Where the market has priced it
4x25x today43x
- the guided figure reached earnings through a low-confidence bridge
- this company has too little filed history for a multiple band of its own, so the exit multiple is the median of 37 Engineering & Construction peers
- at 25x its FY26 earnings the stock already trades above the top of its own ten-year range (20x)
How these numbers are produced
| Earnings base | FY26 fiscal year EPS ₹16.3 (screener) |
|---|---|
| Guided growth | 20% a year, said on the call of 17-Feb-2026 · transcript |
| Read across as | operating: unlabelled growth figure, read as revenue — low confidence |
| Delivery calibration | 0.58x / 1x / 1.36x of what was guided — measured: 76 annual guided-vs-filed pairs + 77 near-complete quarterly years — NSE transcripts against the companies' own filings |
| Exit multiple | 12.46x / 16x / 20.36x, this company’s own p20 / median / p80 across 37 filed years |
| Filed-industry peers | median 16x across 37 peers — the cross-check, not the input |
| Arithmetic | base EPS × (1 + guided growth × delivery)1 × exit multiple |
Arithmetic on management’s own guidance and this company’s own past valuations. Not a price target, not a recommendation, and not a forecast of what the stock will do.
Price chart
260 sessions to 31 Jul 2026 ·
daily close ·
our own broker data