AXISCADES Technologies
Evidence timeline
2026
2026
2026
What management said
Outlook, as stated
To achieve this vision, we have taken up the following initiatives: We are aiming for a robust year-on-year growth of 40% in our core business areas for FY26 and FY27, with further acceleration of over 70% growth projected for FY28, FY29, and FY30 once our infrastructure is fully in place.
Despite Q1 being a traditionally lean quarter, we are pleased to report a healthy performance for Q1 FY26, marked by double-digit growth in our core businesses, steady progress in our transformation roadmap, and clear visibility of growth and profitability in the coming quarters.
The average tax rate appears to be higher at 36% for FY26, as the profits in some of our overseas entities carry a higher tax rate, and also the fact that the company was not able to recognize deferred tax asset in one of our loss-making, you know, entities in Germany.
Chart exhibits
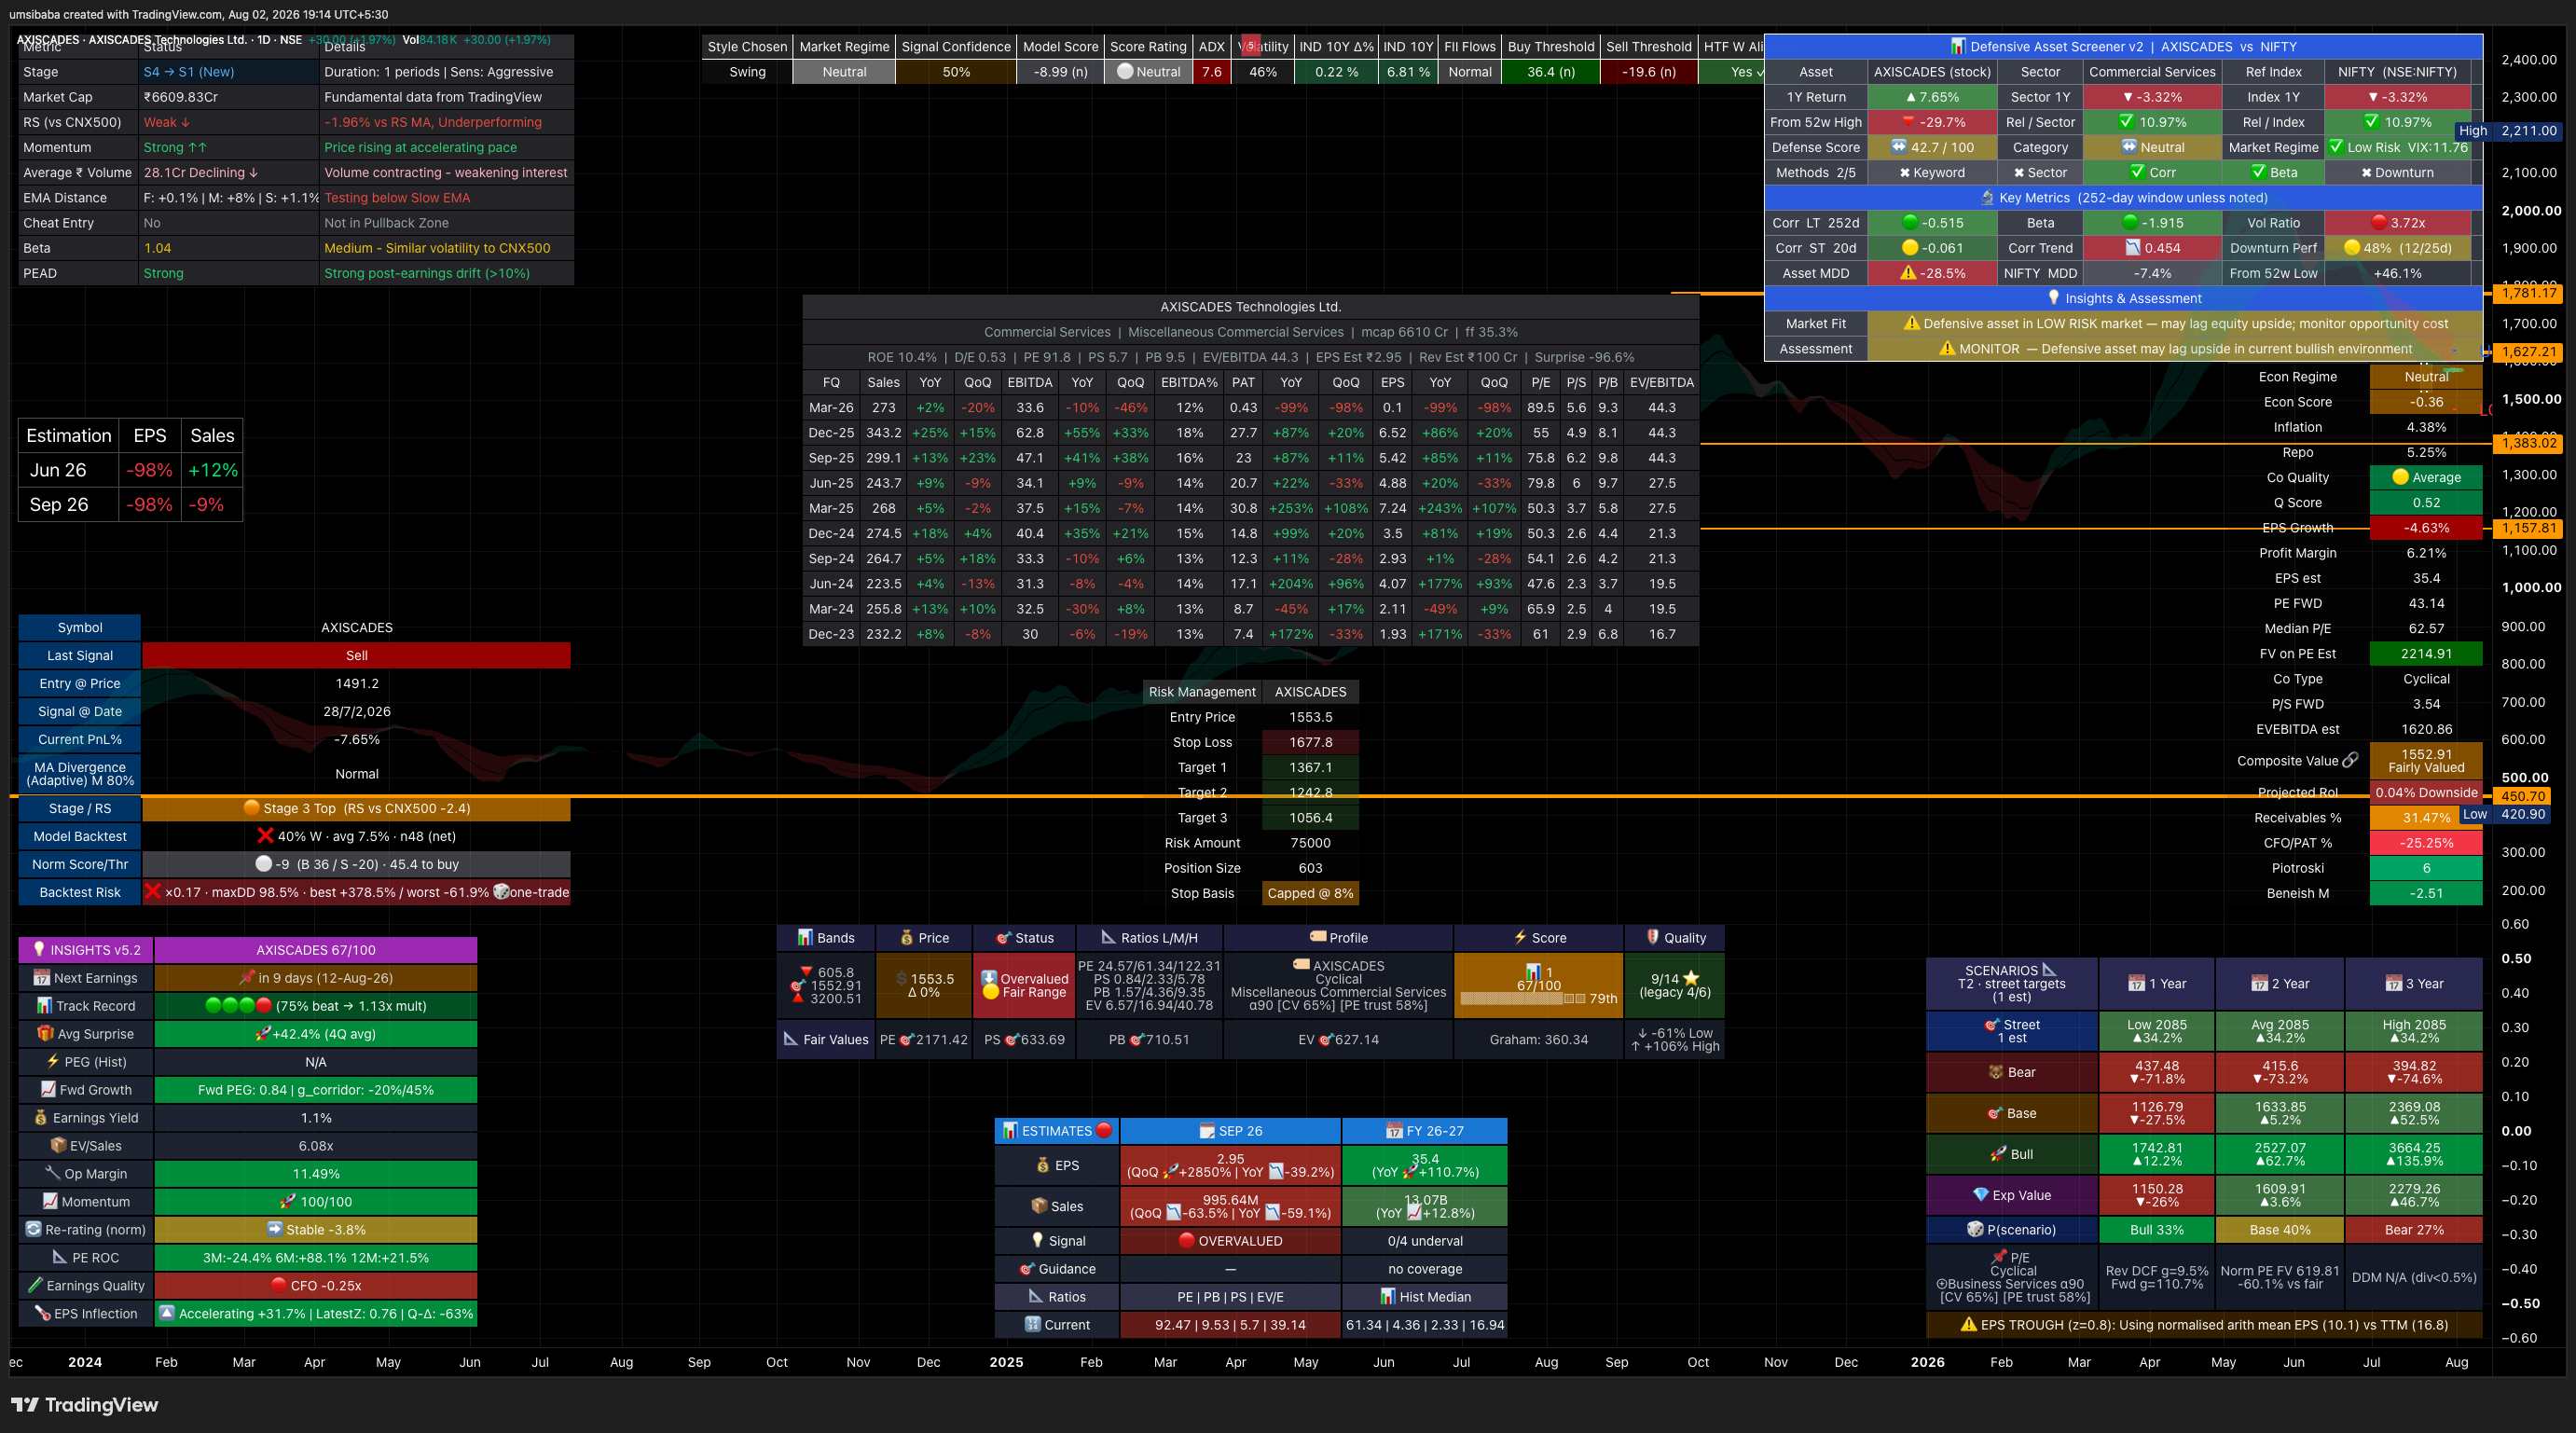
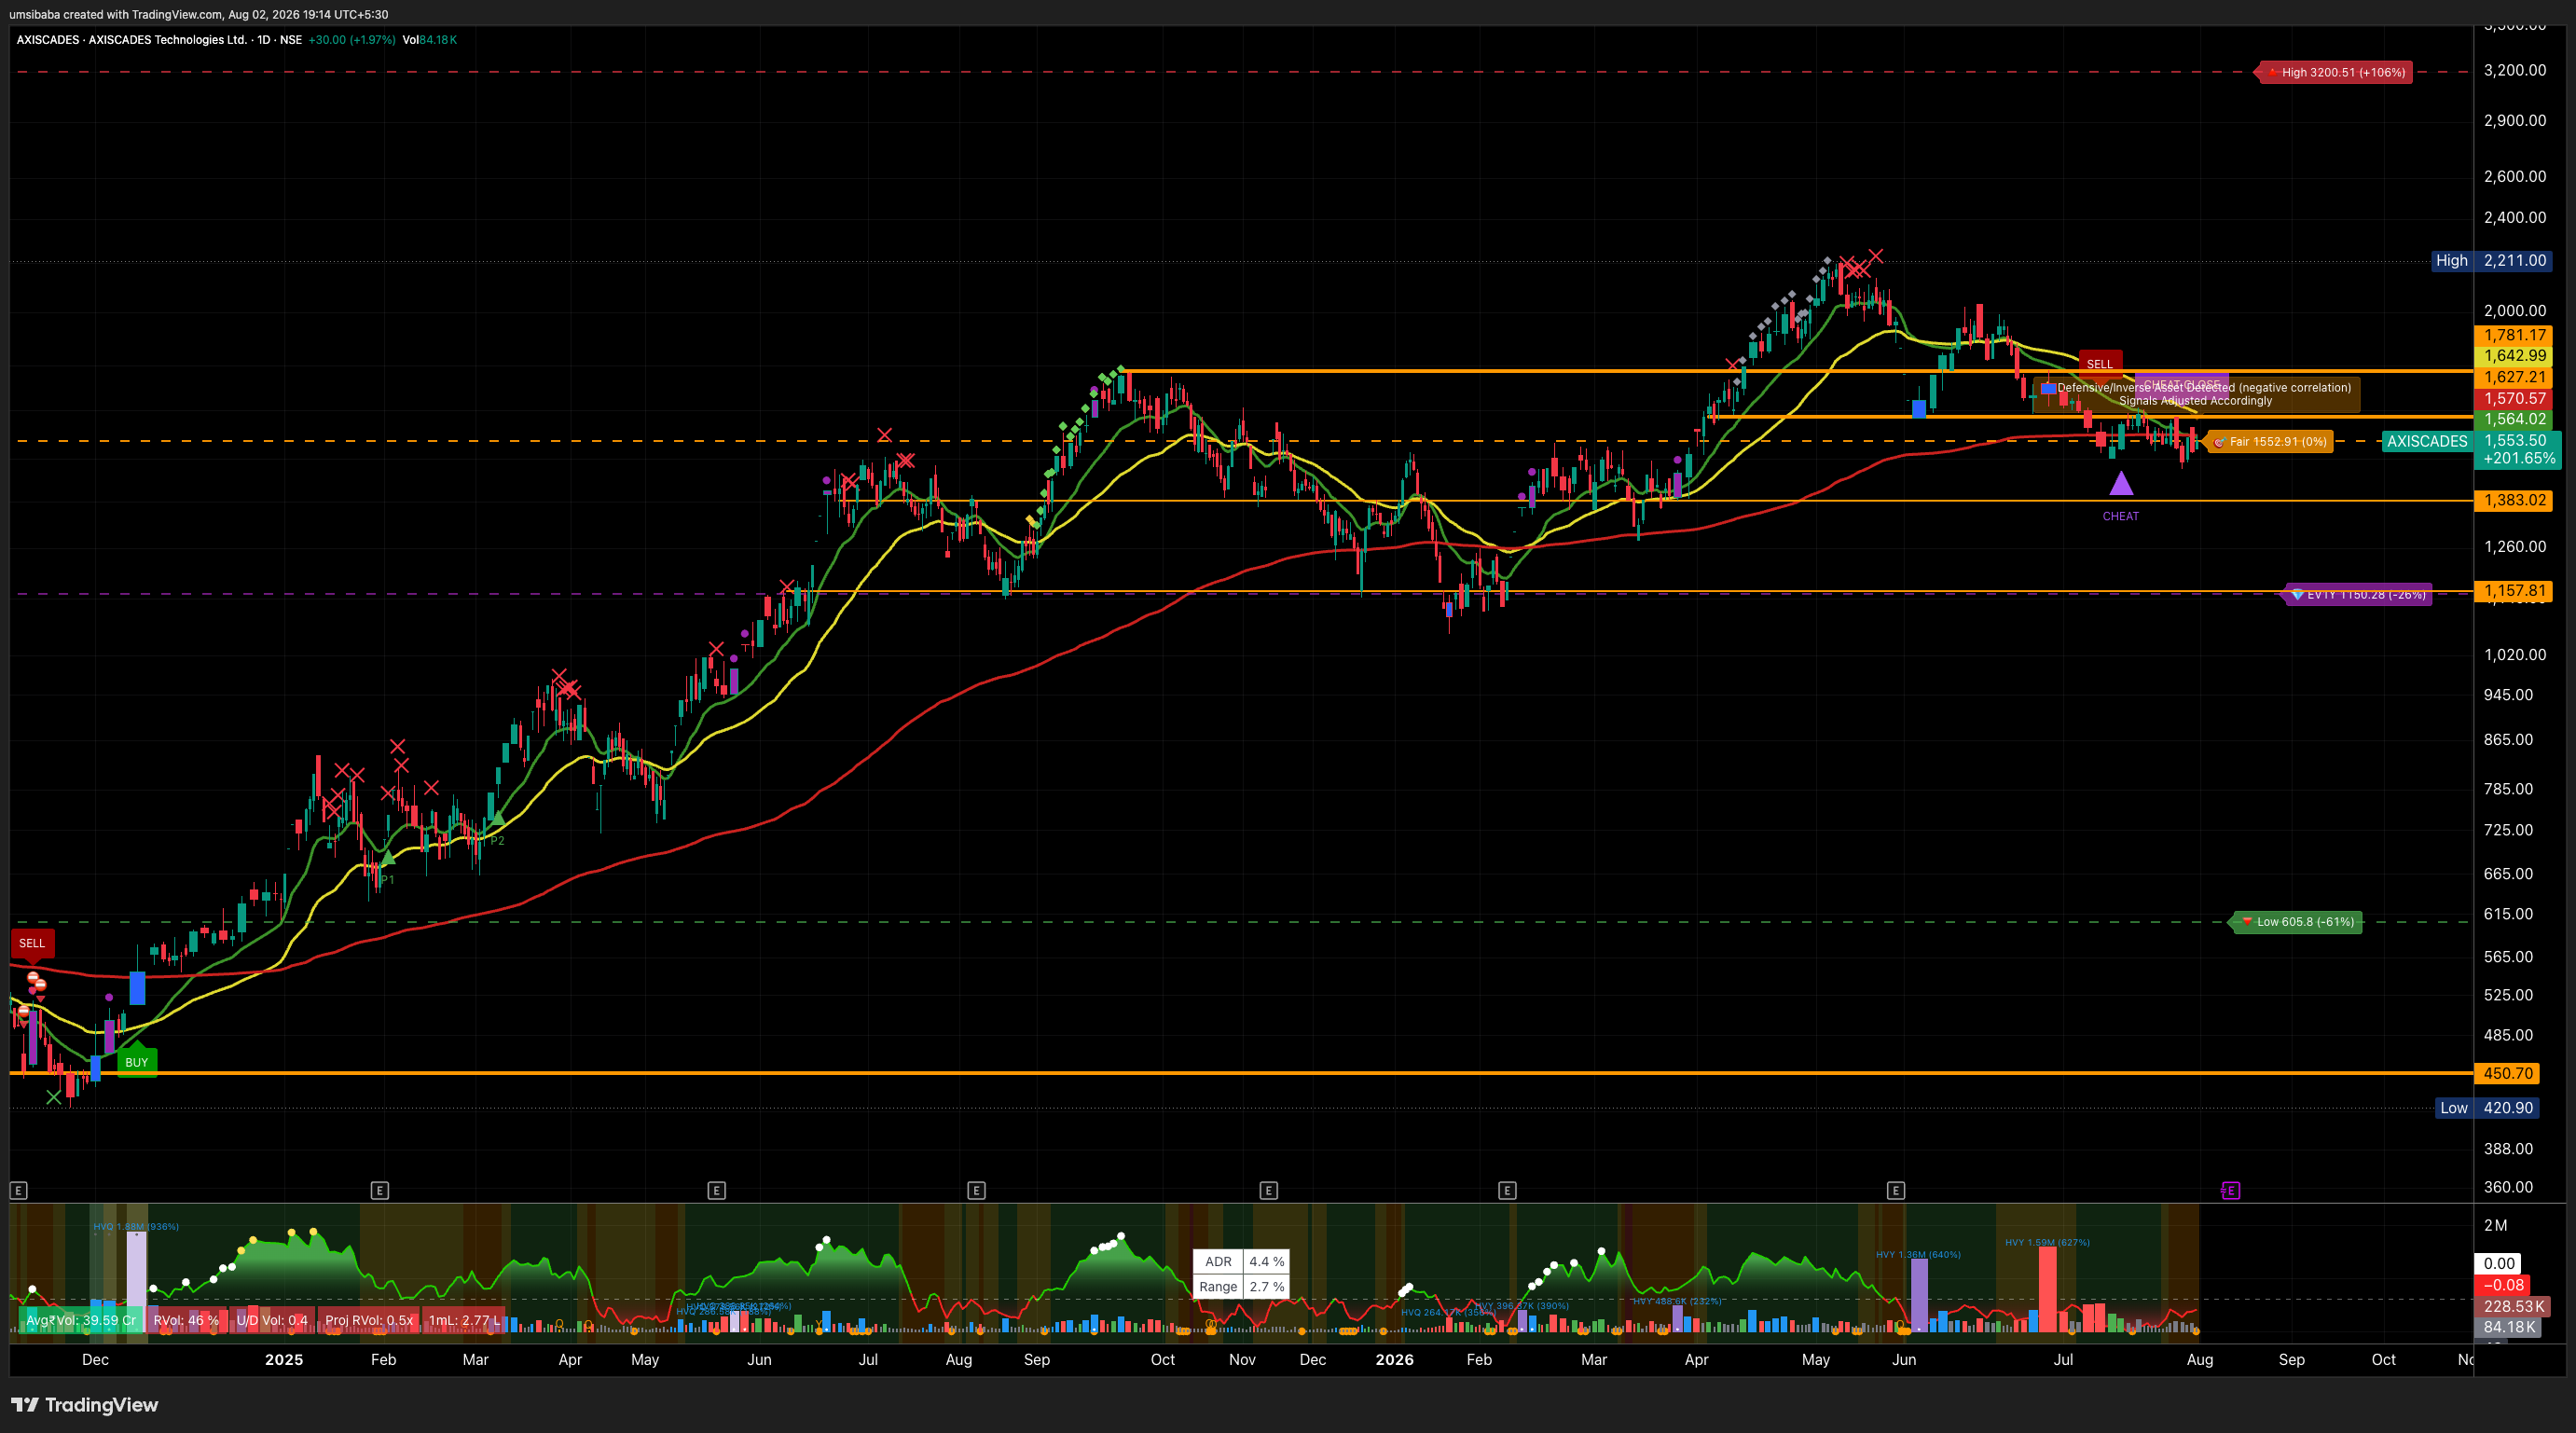
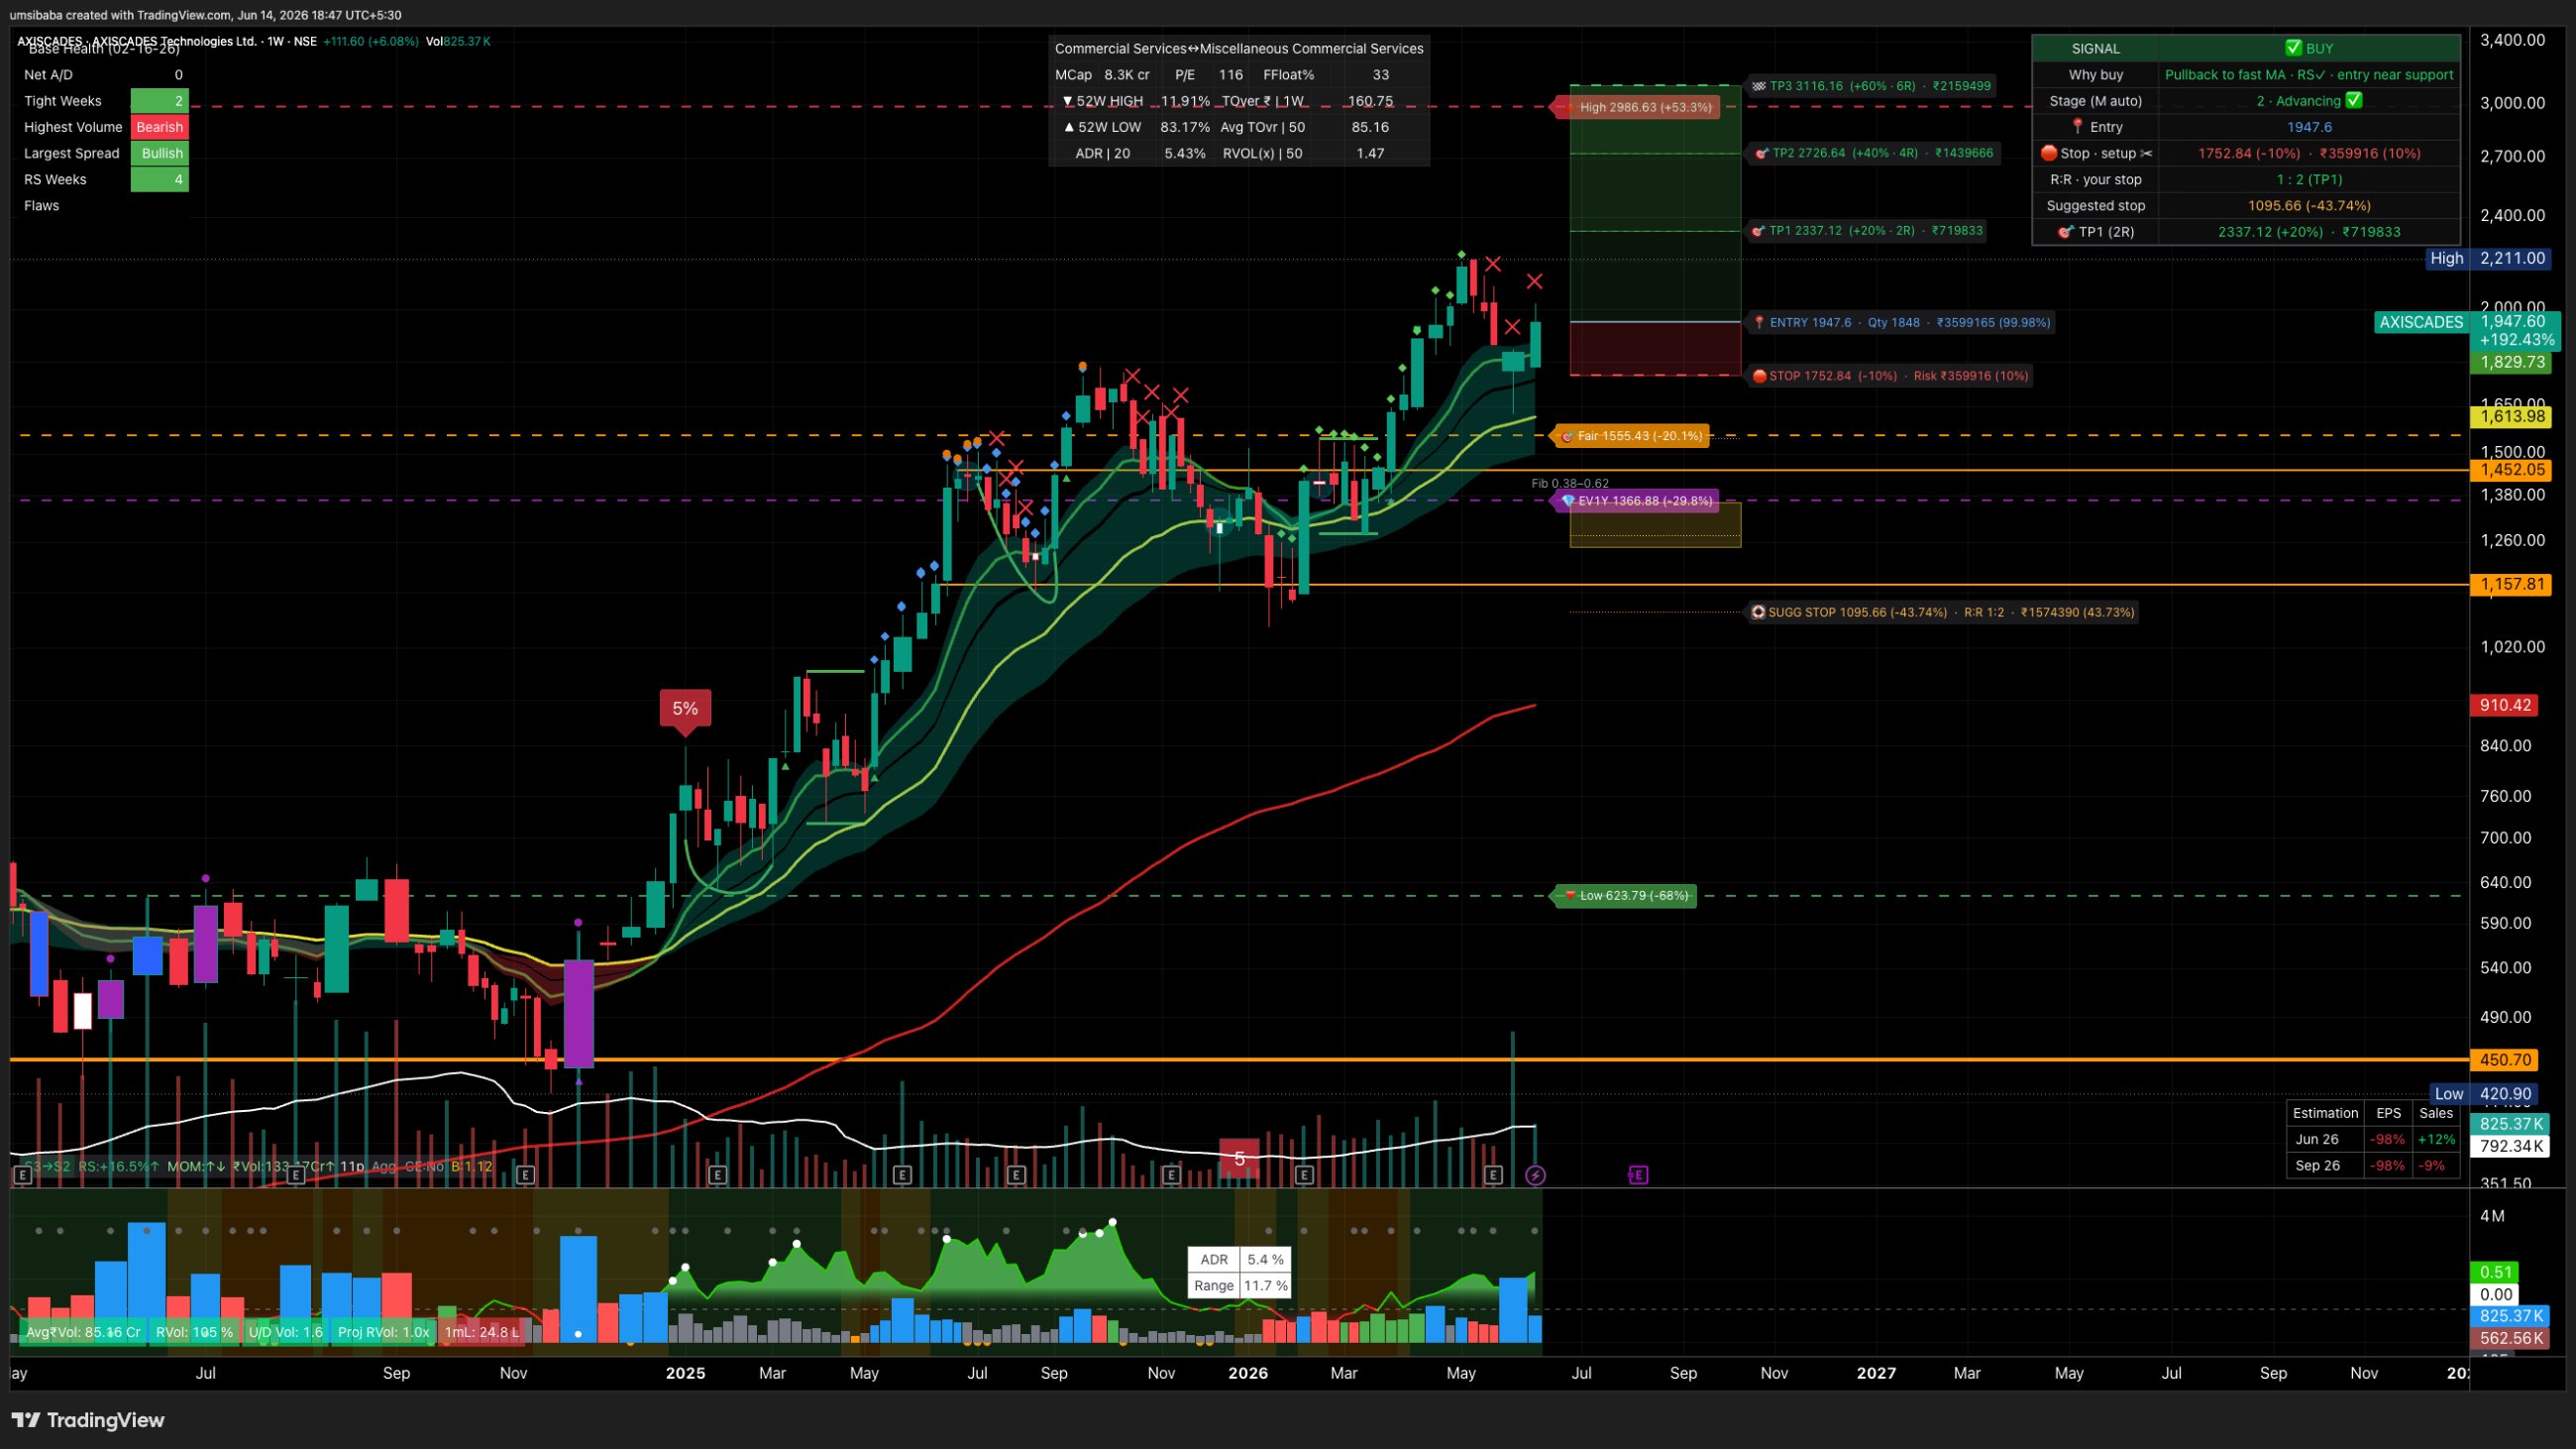
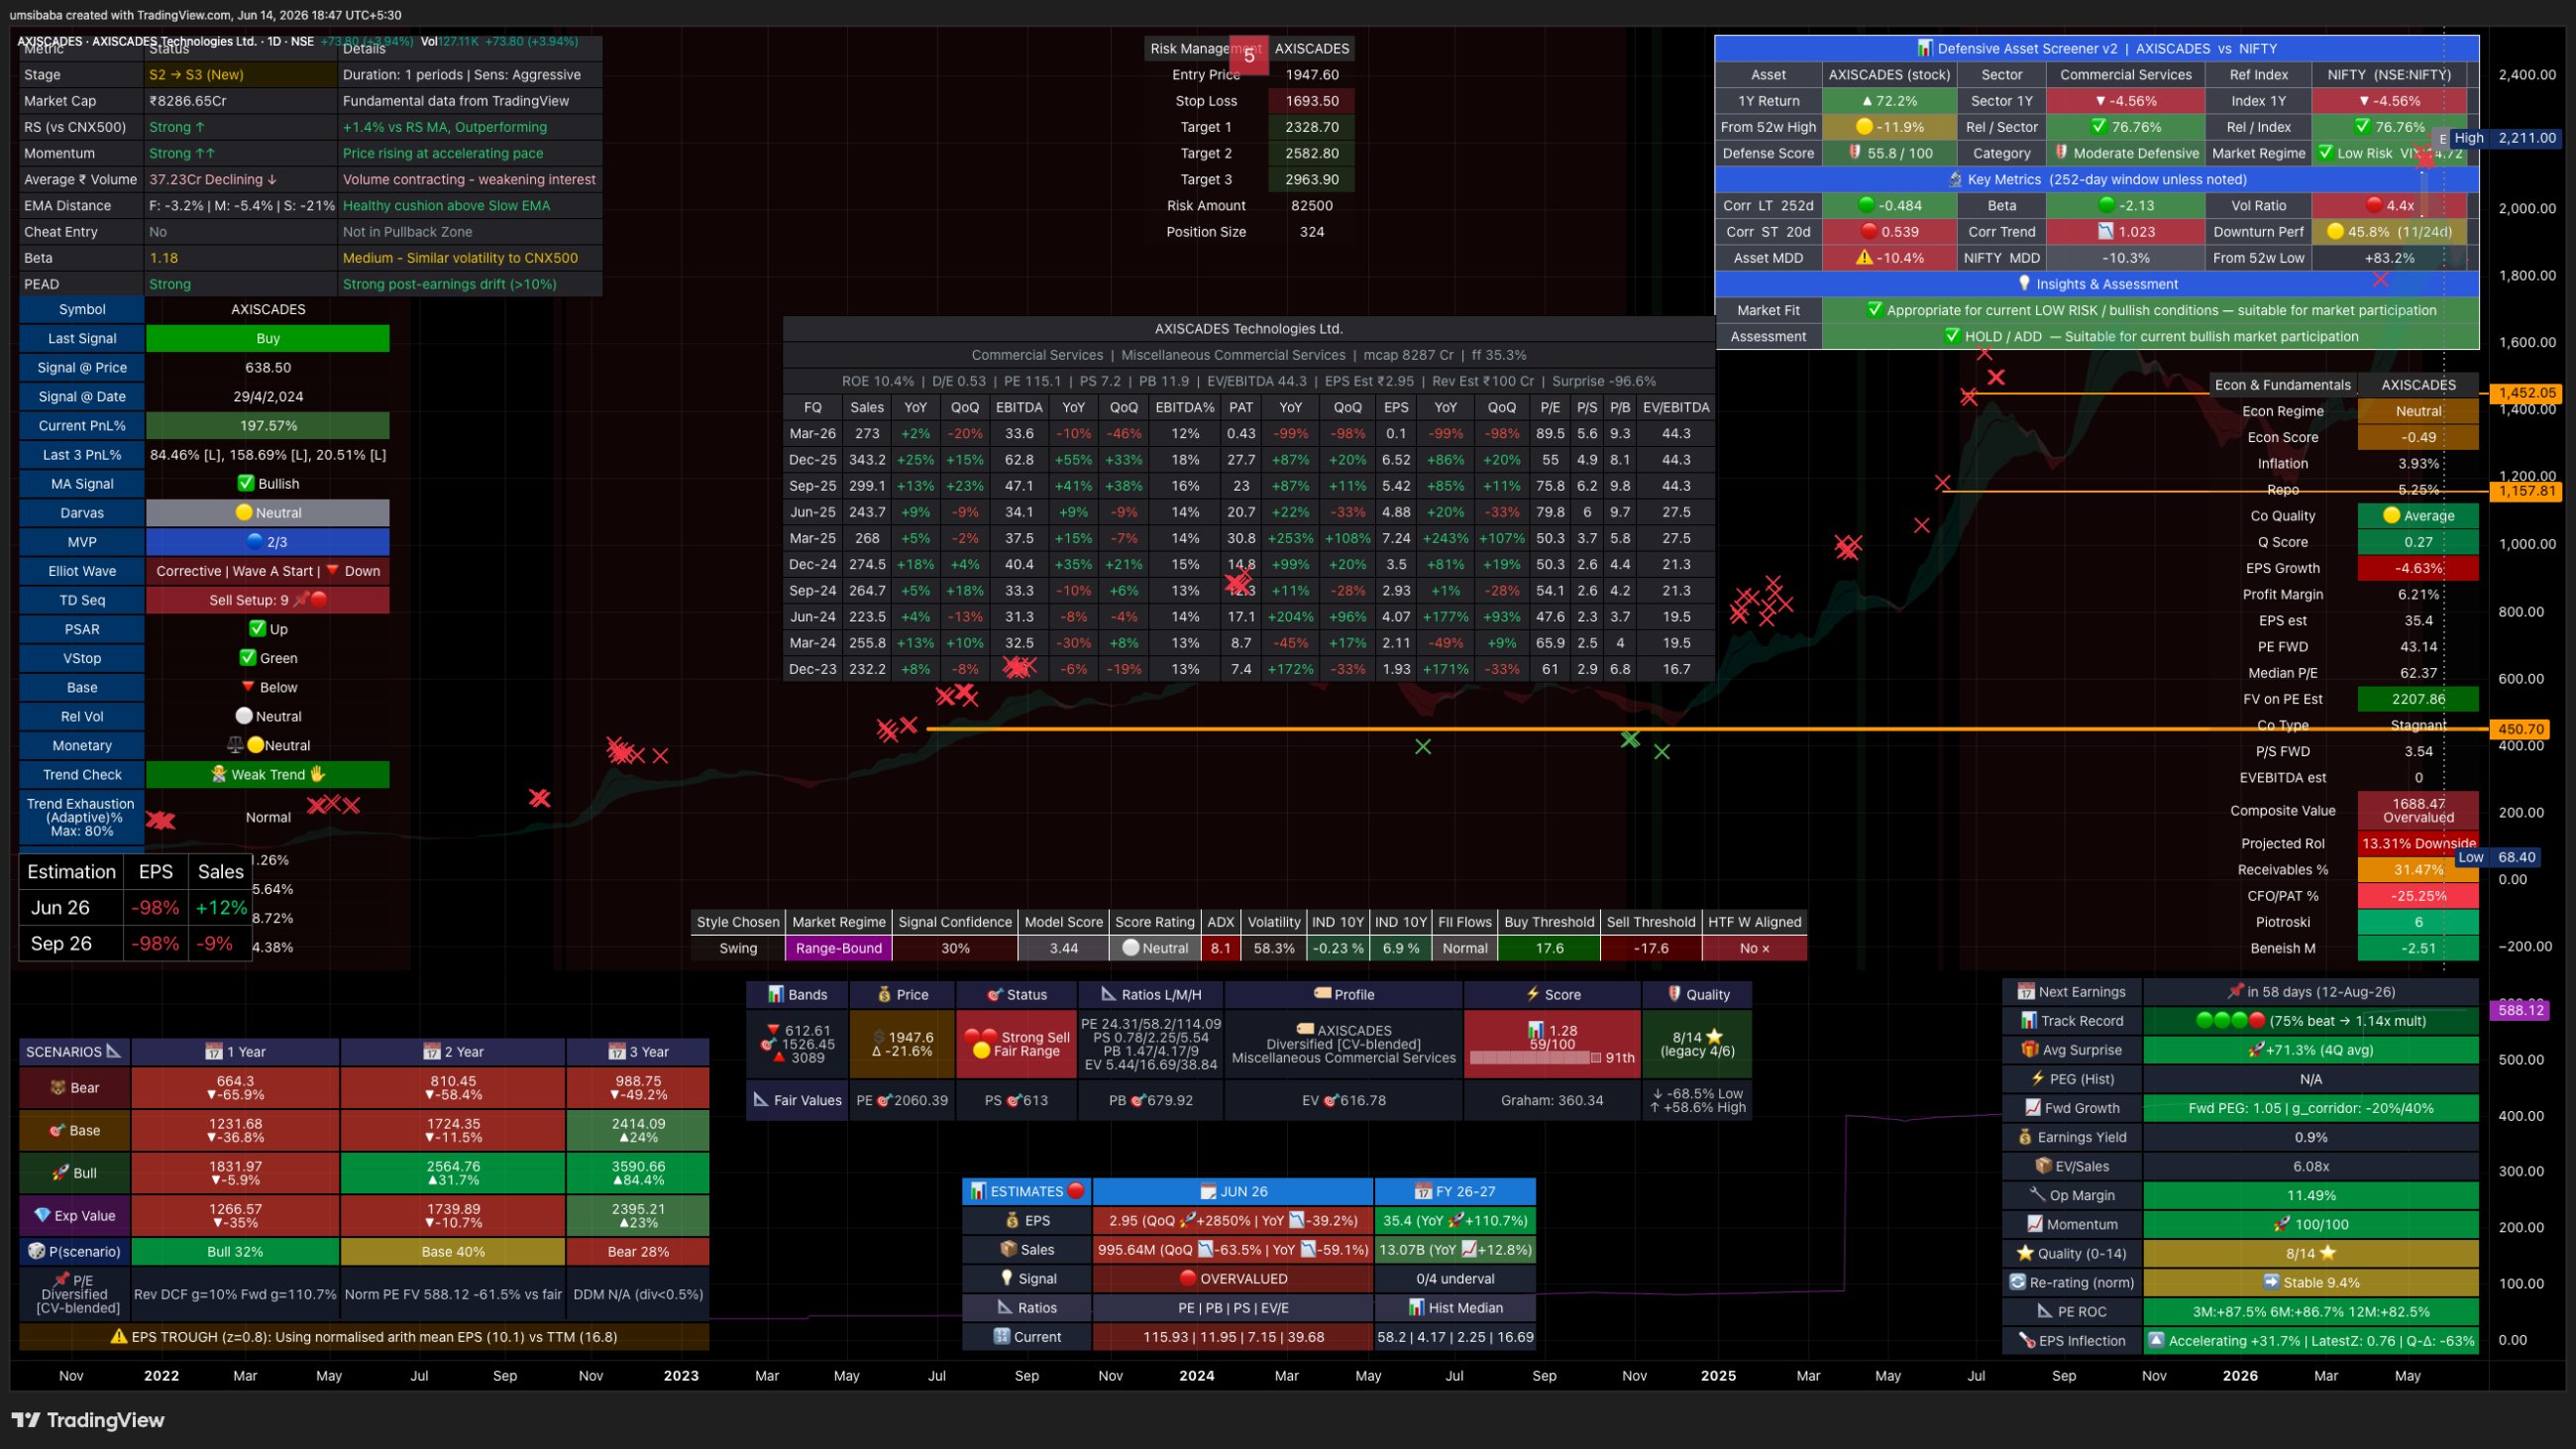
If management delivers what it guided
- the guided figure reached earnings through a low-confidence bridge
- 4 of 10 filed years were loss-making or near zero — this band describes a recovery, not a settled rating
- the last 3 years priced this company 28% above its ten-year median (80x vs 62x) — the exit multiple here is the ten-year one, so a sustained re-rating would not be captured
- at 92x its FY26 earnings the stock already trades above the top of its own ten-year range (90x)
- this company's own median multiple sits 112% above its filed-industry peers; the scenario uses its own
How these numbers are produced
| Earnings base | FY26 fiscal year EPS ₹16.92 (screener) |
|---|---|
| Guided growth | 52% a year, said on the call of 18-Jun-2026 · transcript |
| Read across as | operating: unlabelled growth figure, read as revenue — low confidence |
| Delivery calibration | 0.58x / 1x / 1.36x of what was guided — measured: 76 annual guided-vs-filed pairs + 77 near-complete quarterly years — NSE transcripts against the companies' own filings |
| Exit multiple | 29.19x / 62.32x / 90x, this company’s own p20 / median / p80 across 6 filed years |
| Filed-industry peers | median 29.36x across 19 peers — the cross-check, not the input |
| Arithmetic | base EPS × (1 + guided growth × delivery)1 × exit multiple |